
The United States
Highlights
- Good performance of retail lending.
- Positive trend in net interest income and customer spreads.
- The improvement in the efficiency ratio continues.
- Net attributable profit affected by the impairment on financial assets associated with specific customers of the commercial portfolio and to write-offs in consumer loans.
Business activity (1)
(Year-on-year change at constant exchange rate. Data as of 30-06-19)
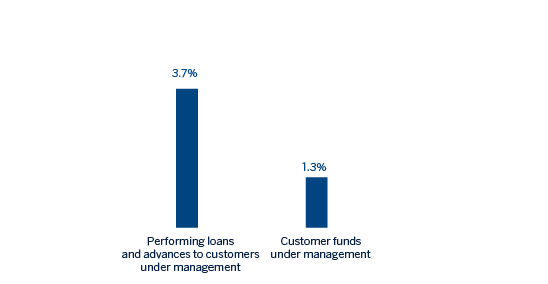
(1) Excluding repos.
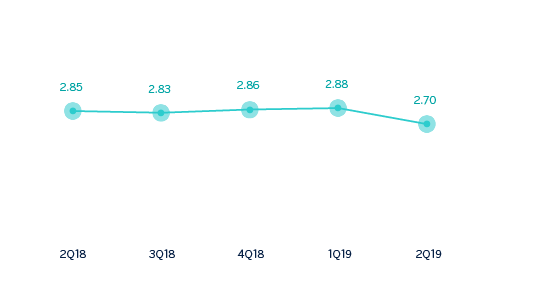
Net interest income/ATAs
(Percentage. Constant exchange rate)
Operating income
(Millions of euros at constant exchange rate)
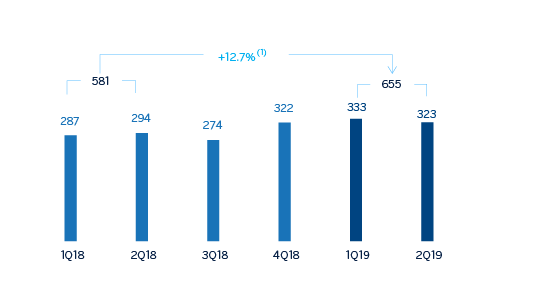
(1) At current exchange rate: +20.5%.
Net attributable profit
(Millions of euros at constant exchange rate)
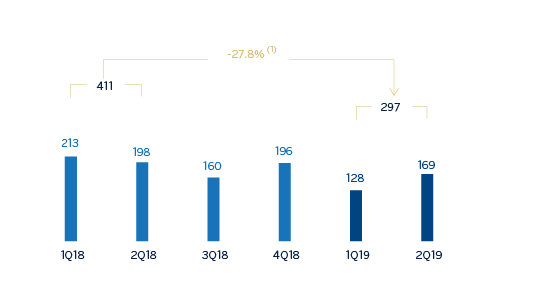
(1) At current exchange rate: -22.9%.
Financial statements and relevant business indicators
(Millions of euros and percentage)
| Income statement | 1H19 | ∆% | ∆% (1) | 1H18 |
|---|---|---|---|---|
| Net interest income | 1,217 | 12.6 | 5.2 | 1,082 |
| Net fees and commissions | 320 | 5.8 | (1.0) | 302 |
| Net trading income | 79 | 61.8 | 52.5 | 49 |
| Other operating income and expenses | (1) | n.s. | n.s. | 4 |
| Gross income | 1,615 | 12.4 | 5.1 | 1,437 |
| Operating expenses | (959) | 7.5 | 0.4 | (893) |
| Personnel expenses | (554) | 8.0 | 0.9 | (513) |
| Other administrative expenses | (295) | 0.5 | (6.1) | (294) |
| Depreciation | (110) | 28.3 | 19.8 | (86) |
| Operating income | 655 | 20.5 | 12.7 | 544 |
| Impaiment on financial assets not measured at fair value through profit or loss | (286) | n.s. | n.s. | (63) |
| Provisions or reversal of provisions and other results | (6) | n.s. | n.s. | 12 |
| Profit/(loss) before tax | 363 | (26.3) | (31.0) | 493 |
| Income tax | (67) | (38.4) | (42.3) | (108) |
| Profit/(loss) for the year | 297 | (22.9) | 27.8 | 385 |
| Non-controlling interests | - | - | - | - |
| Net attributable profit | 297 | (22.9) | (27.8) | 385 |
| Balance sheets | 30-06-19 | ∆% | ∆%(1) | 31-12-18 |
|---|---|---|---|---|
| Cash. cash balances at central banks and other demand deposits | 7,504 | 55.2 | 54.2 | 4,835 |
| Financial assets designated at fair value | 10,283 | (1.9) | (2.5) | 10,481 |
| Of which loans and advances | 1,433 | n.s. | n.s. | 156 |
| Financial assets at amortized cost | 64,839 | 2.0 | 1.4 | 63,539 |
| Of which loans and advances to customers | 60,130 | (1.1) | (1.7) | 60,808 |
| Inter-area positions | - | - | - | - |
| Tangible assets | 925 | 38.4 | 37.5 | 668 |
| Other assets | 2,678 | 5.7 | 5.0 | 2,534 |
| Total assets/liabilities and equity | 86,229 | 5.1 | 4.4 | 82,057 |
| Financial liabilities held for trading and designated at fair value through profit or loss | 1,475 | n.s. | n.s. | 234 |
| Deposits from central banks and credit institutions | 4,568 | 35.6 | 34.7 | 3,370 |
| Deposits from customers | 63,122 | (1.2) | (1.8) | 63,891 |
| Debt certificates | 3,382 | (6.0) | (6.6) | 3,599 |
| Inter-area positions | 3,757 | 95.0 | 93.8 | 1,926 |
| Other liabilities | 6,232 | 10.2 | 9.6 | 5,654 |
| Economic capital allocated | 3,692 | 9.1 | 8.5 | 3,383 |
| Relevant business indicators | 30-06-19 | ∆% | ∆% (1) | 31-12-18 |
|---|---|---|---|---|
| Performing loans and advances to customers under management (2) | 60,172 | (1.0) | (1.6) | 60,784 |
| Non-performing loans | 827 | 3.2 | 2.5 | 802 |
| Customer deposits under management (2) | 63,120 | (1.2) | (1.8) | 63,888 |
| Off-balance sheet funds (3) | - | - | - | - |
| Risk-weighted assets | 62,383 | (2.8) | (3.4) | 64,175 |
| Efficiency ratio (%) | 59.4 | 62.2 | ||
| NPL ratio (%) | 1.3 | 1.3 | ||
| NPL coverage ratio (%) | 91 | 85 | ||
| Cost of risk (%) | 0.94 | 0.39 |
- (1) Figures at constant exchange rate.
- (2) Excluding repos.
- (3) Includes mutual funds, pension funds and other off-balance-sheet funds.
Activity
Unless expressly stated otherwise, all the comments below on rates of change, for both activity and earnings, will be given at constant exchange rate. These rates, together with changes at current exchange rate, can be seen in the attached tables of financial statements and relevant business indicators. In addition, the quarterly variations are from the quarter ending with respect to the previous quarter.
The most relevant evolution to the area’s activity in the first semester of 2019 was:
- Lending activity (performing loans under management) showed a decrease of 1.6% year-to-date, although it grew by 3.7% compared to the figure for the same period of the previous year. Loan growth has been moderate throughout 2019, mainly due to a contraction in the commercial portfolio as well as, to a lesser extent, in the retail portfolio.
- The commercial portfolio showed a negative evolution in the semester (down 1.8%) but increased year-on-year (up 3.7%). The high level of interest rates continued to negatively affect the mortgages portfolios (down 0.4% year-to-date and up 0.9% year-on-year). Regarding the rest of retail portfolios, credit cards and consumer loan portfolios, which are increasingly being granted through digital channels and have higher margins, decreased slightly by 1.6% year-to-date but increased by 11.2% year-on-year.
- Regarding the risk indicators, the NPL ratio remained stable throughout the semester at 1.3%.The NPL coverage ratio improved to 91% as of June 30, 2019.
- As the competition for deposits remains intense, customer deposits under management decreased slightly by 1.8% year-to-date but increased 1.3% year-on-year, mainly due to the increase in time deposits (up 4.0% year-on-year, down 5.9% in the semester) and, to a lesser extent, in demand deposits (up 0.4% year-on-year, down 0.4% year-to-date).
Results
The United States generated a cumulative net attributable profit of €297m in the first half of 2019, down 27.8% year-on-year, as a result of higher levels of impairments on financial assets registered in the first six months of 2019. The most relevant aspects of the evolution of the results are summarized below:
- Net interest income continued to perform positively, with an increase of 5.2% year-on-year, despite the current market situation in the United States, which is affected by the uncertainties about the monetary policy decisions that the FED will take.
- Net fees and commissions decreased by 1.0% year-on-year, mainly due to those related to deposits and investment banking and a lower contribution from markets.
- Higher contribution from NTI due to the good performance during the first half of 2019 associated with higher ALCO portfolio sales in the first quarter of 2019.
- Operating expenses grew slightly by 0.4% year-on-year but this increase is lower than the growth in gross income (up 5.1%), as a result, the efficiency ratio improved.
- Impairment losses on financial assets increased during the first half of 2019, due to provisions for some specific commercial customers, a higher level of write-offs in the consumer portfolio and, to a lesser extent, to the macro scenario adjustment. In addition, 2018 was positively impacted by the release of provisions related to the hurricanes the previous year. As a result, the cumulative cost of risk on June 30, 2019 increased to 0.94% compared to 0.39% on December 31, 2018.