
Other information: Corporate & Investment Banking
Highlights
- Good performance of customer activity, which is reflected in the net interest income and fees and commissions.
- Excellent performance of NTI.
- Leadership position in green and sustainable loans.
- Net attributable profit affected by the significant increase in the impairment on financial assets line.
Business activity (1)
(Year-on-year change at constant exchange rates. Data as of 30-06-20)
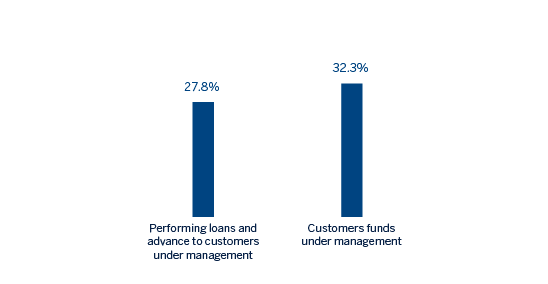
(1) Excluding repos.
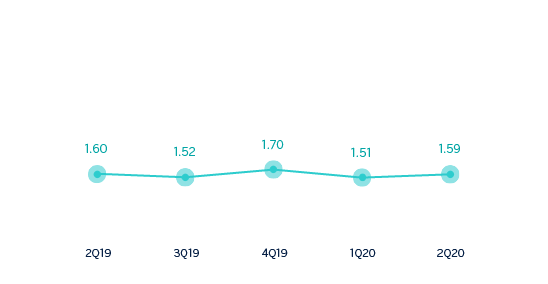
Gross income/ATAs
(Percentage. Constant exchange rates)
Operating income
(Millions of euros at constant exchange rates)
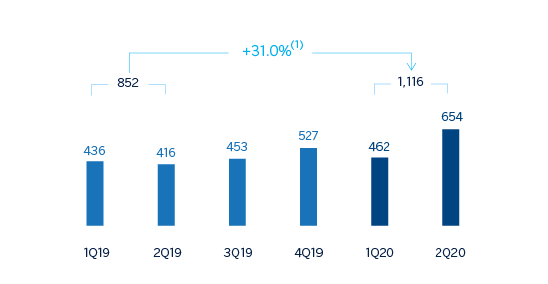
(1) At current exchange rate: +20.0%.
Net attributable profit
(Millions of euros at constant exchange rates)
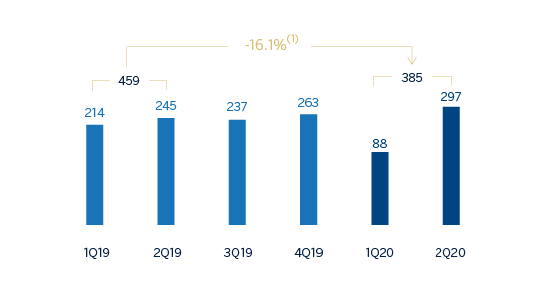
(1) At current exchange rate: -22.4%.
Financial statements and relevant business indicators (Millions of euros and percentage)
| Income statement | 1H 2020 | ∆% | ∆% (1) | 1H 2019 |
|---|---|---|---|---|
| Net interest income | 806 | 5.6 | 14.1 | 763 |
| Net fees and commissions | 402 | 14.8 | 21.5 | 350 |
| Net trading income | 417 | 13.0 | 21.0 | 369 |
| Other operating income and expenses | (23) | (12.6) | (0.7) | (27) |
| Gross income | 1,602 | 10.0 | 17.9 | 1,456 |
| Operating expenses | (486) | (7.5) | (4.1) | (525) |
| Personnel expenses | (202) | (14.4) | (12.5) | (236) |
| Other administrative expenses | (224) | (0.8) | 5.1 | (225) |
| Depreciation | (60) | (5.7) | (4.5) | (64) |
| Operating income | 1,116 | 20.0 | 31.0 | 930 |
| Impairment on financial assets not measured at fair value through profit or loss | (426) | n.s. | n.s. | (79) |
| Provisions or reversal of provisions and other results | (36) | n.s. | n.s. | 18 |
| Profit/(loss) before tax | 655 | (24.8) | (17.7) | 870 |
| Income tax | (182) | (14.7) | (5.8) | (213) |
| Profit/(loss) for the year | 473 | (28.0) | (21.5) | 657 |
| Non-controlling interests | (88) | (45.3) | (38.8) | (161) |
| Net attributable profit | 385 | (22.4) | (16.1) | 496 |
- (1) Figures at constant exchange rates.
| Balance sheets | 30-06-20 | ∆% | ∆% (1) | 31-12-19 |
|---|---|---|---|---|
| Cash, cash balances at central banks and other demand deposits | 4,204 | 19.7 | 21.1 | 3,513 |
| Financial assets designated at fair value | 122,595 | 16.3 | 19.6 | 105,386 |
| Of which Loans and advances | 36,838 | 7.9 | 8.1 | 34,153 |
| Financial assets at amortized cost | 87,077 | 14.3 | 20.5 | 76,169 |
| Of which loans and advances to customers | 74,335 | 12.8 | 19.0 | 65,915 |
| Inter-area positions | - | - | - | - |
| Tangible assets | 55 | (13.2) | (8.2) | 63 |
| Other assets | 1,523 | (39.2) | (39.3) | 2,506 |
| Total assets/liabilities and equity | 215,454 | 14.8 | 19.1 | 187,637 |
| Financial liabilities held for trading and designated at fair value through profit or loss | 109,956 | 20.0 | 23.1 | 91,657 |
| Deposits from central banks and credit institutions | 15,169 | (1.7) | (0.4) | 15,426 |
| Deposits from customers | 43,994 | 12.3 | 20.1 | 39,166 |
| Debt certificates | 1,855 | (29.3) | (26.4) | 2,625 |
| Inter-area positions | 35,545 | 13.5 | 18.3 | 31,316 |
| Other liabilities | 4,464 | 50.9 | 55.8 | 2,959 |
| Economic capital allocated | 4,472 | (0.3) | 5.5 | 4,487 |
- (1) Figures at constant exchange rates.
| Relevant business indicators | 30-06-20 | ∆% | ∆% (1) | 31-12-19 |
|---|---|---|---|---|
| Performing loans and advances to customers under management (2) | 74,039 | 13.0 | 19.2 | 65,509 |
| Non-performing loans | 1,104 | (8.8) | 0.1 | 1,211 |
| Customer deposits under management (3) | 43,885 | 12.1 | 19.9 | 39,150 |
| Off-balance sheet funds (4) | 1,397 | 34.7 | 57.7 | 1,037 |
| Efficiency ratio (%) | 30.3 | 35.2 |
- (1) Figures at constant exchange rates.
- (2) Excluding repos.
- (3) Includes mutual funds, pension funds and other off-balance sheet funds.
Activity
Unless expressly stated otherwise, all the comments below on rates of change, for both activity and profit and loss, will be given at constant exchange rates. These rates, together with the changes at current exchange rates, can be found in the attached tables of the financial statements and relevant business indicators.
The most relevant aspects related to the area's activity during the first half of 2020 have been:
- Lending activity (performing loans under management) continued with its double-digit growth (up 19.2% between January and June 2020) and there was a positive performance in all geographical areas, with the Rest of Eurasia, Turkey and the United States standing out, as a result of the increased drawdown of credit facilities by customers to deal with the situation created by COVID-19 from a more comfortable liquidity position.
- Customer funds also registered a strong increase of 20.8% in the first half, mainly as a result of the placement of liquidity in the bank. By geographical area, the United States and Spain stood out.
At the end of the first half of 2020, it is worth mentioning that BBVA, within its strategic priority of “helping our clients transition towards a sustainable future” participated in a total of 23 transactions within the field of sustainable financing, leading twelve of them as a sustainable coordinator.
Results
CIB generated a net attributable profit of €385m in the first half of 2020, which is 16.1% less in the year-on-year comparison. This is due to the increase in the impairment on financial assets, as operating income grew by 31.0% over the same period of time. The most relevant aspects of the year-on-year changes in the income statement for Corporate & Investment Banking are summarized below:
- Positive performance of net interest income (up 14.1%) due to the performance of lending activity, with higher volumes and an improvement in profitability per transaction due to the sales effort.
- Double-digit increase in net fees and commissions (up 21.5%), supported by transactional business and investment, and finance banking in most geographical areas.
- The NTI recovered during the second quarter of the year and registered an accumulated year-on-year growth of 21.0%, due to the good performance of customer activity and good management of market volatility, especially in Mexico, Rest of Europe and the United States.
- As a result, gross income increased by 17.9%.
- The efficiency ratio improved to 30.3% due to operating expenses falling significantly (down 4.1%), thanks to the containment plans implemented by the area and also partly due to savings in some expenditures as a result of the lockdown.
- Provisions for impairment on financial assets increased significantly due to the provisions related to COVID-19, which includes the deterioration of the macroeconomic scenario.