
The United States
Highlights
- Increase in loans focused on the commercial portfolios, whereas retail segments have been affected by the lockdown. Strong increase in customer deposits.
- Contained risk indicators.
- Net interest income affected by the Fed’s rate cuts. Positive evolution of fees and commissions and NTI.
- Net attributable profit affected by the significant increase in the impairment on financial assets line.
Business activity (1)
(Year-on-year change at constant exchange rate. Data as of 30-06-20)

(1) Excluding repos.
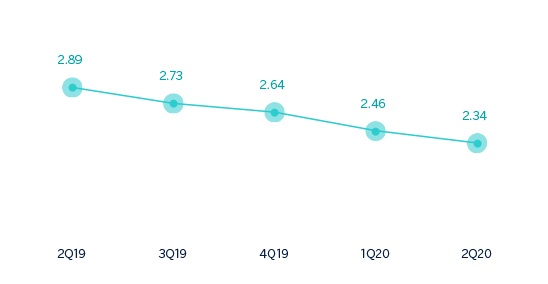
Net interest income/ATAs
(Percentage. Constant exchange rate)
Operating income
(Millions of euros at constant exchange rate)

(1) At current exchange rate: -1.1%.
Net attributable profit
(Millions of euros at constant exchange rate)
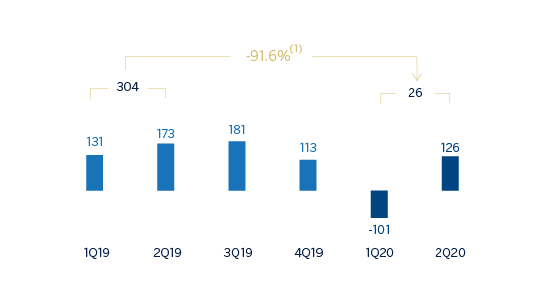
(1) At current exchange rate: -91.4
Financial statements and relevant business indicators
(Millions of euros and percentage)
| Income statement | 1H20 | ∆% | ∆% (1) | 1H19 |
|---|---|---|---|---|
| Net interest income | 1,133 | (6.9) | (9.2) | 1,217 |
| Net fees and commissions | 336 | 5.2 | 2.6 | 320 |
| Net trading income | 148 | 87.3 | 83.1 | 79 |
| Other operating income and expenses | (10) | n.s. | n.s. | (1) |
| Gross income | 1,607 | (0.5) | (2.9) | 1,615 |
| Operating expenses | (959) | (0.0) | (2.5) | (959) |
| Personnel expenses | (558) | 0.6 | (1.8) | (554) |
| Other administrative expenses | (295) | 0.0 | (2.4) | (295) |
| Depreciation | (106) | (3.6) | (6.0) | (110) |
| Operating income | 648 | (1.1) | (3.5) | 655 |
| Impaiment on financial assets not measured at fair value through profit or loss | (614) | 114.5 | 109.2 | (286) |
| Provisions or reversal of provisions and other results | (19) | 232.0 | 222.0 | (6) |
| Profit/(loss) before tax | 15 | (95.8) | (95.9) | 363 |
| Income tax | 11 | n.s. | n.s. | (67) |
| Profit/(loss) for the year | 26 | (91.4) | (91.6) | 297 |
| Non-controlling interests | - | - | - | - |
| Net attributable profit | 26 | (91.4) | (91.6) | 297 |
| Balance sheets | 30-06-20 | ∆% | ∆%(1) | 31-12-19 |
|---|---|---|---|---|
| Cash, cash balances at central banks and other demand deposits | 13,908 | 67.7 | 67.2 | 8,293 |
| Financial assets designated at fair value | 6,955 | (9.2) | (9.5) | 7,659 |
| Of which: Loans and advances | 384 | 46.9 | 46.4 | 261 |
| Financial assets at amortized cost | 76,800 | 10.5 | 10.1 | 69,510 |
| Of which: Loans and advances to customers | 68,668 | 8.7 | 8.4 | 63,162 |
| Inter-area positions | - | - | - | - |
| Tangible assets | 907 | (0.8) | (1.1) | 914 |
| Other assets | 2,548 | 18.4 | 18.0 | 2,153 |
| Total assets/liabilities and equity | 101,118 | 14.2 | 13.9 | 88,529 |
| Financial liabilities held for trading and designated at fair value through profit or loss | 459 | 62.8 | 62.3 | 282 |
| Deposits from central banks and credit institutions | 6,229 | 52.6 | 52.1 | 4,081 |
| Deposits from customers | 75,649 | 12.0 | 11.7 | 67,525 |
| Debt certificates | 3,177 | (10.5) | (10.8) | 3,551 |
| Inter-area positions | 4,985 | 45.9 | 45.5 | 3,416 |
| Other liabilities | 6,703 | 15.0 | 14.6 | 5,831 |
| Economic capital allocated | 3,916 | 1.9 | 1.6 | 3,843 |
| Relevant business indicators | 30-06-20 | ∆% | ∆% (1) | 31-03-19 |
|---|---|---|---|---|
| Performing loans and advances to customers under management (2) | 69,206 | 9.4 | 9.1 | 63,241 |
| Non-performing loans | 822 | 12.6 | 12.2 | 730 |
| Customer deposits under management (2) | 75,651 | 12.0 | 11.7 | 67,528 |
| Off-balance sheet funds (3) | - | - | - | - |
| Risk-weighted assets | 66,889 | 2.6 | 2.3 | 65,170 |
| Efficiency ratio (%) | 59.7 | 61.0 | ||
| NPL ratio (%) | 1.1 | 1.1 | ||
| NPL coverage ratio (%) | 133 | 101 | ||
| Cost of risk (%) | 1.80 | 0.88 |
- (1) Figures at constant exchange rate.
- (2) Excluding repos.
- (3) Includes mutual funds, pension funds and other off-balance sheet funds.
Activity
Unless expressly stated otherwise, all the comments below on rates of change, for both activity and earnings, will be given at constant exchange rates. These rates, together with changes at current exchange rates, can be found in the attached tables of financial statements and relevant business indicators.
The most relevant aspects related to the area's activity during the first half of 2020 were:
- The lending activity for the area (performing loans under management) showed an increase of 9.1%, mainly due to the dynamism of the commercial portfolio of CIB (up 22.6%) and the segment of corporate and commercial banking (up 12.7%), the latter supported by the Paycheck Protection Program (PPP). The rest of the retail portfolio showed negative variations compared to the end of 2019 (down 1.1%) as it has been affected by lower activity levels as a result of the lockdown.
- In terms of the risk indicators, the NPL ratio remained stable over the semester and closed at 1.1%. The NPL coverage ratio improved to 133%.
- Customer deposits under management increased by 11.7% in the semester, aided by the disposal of customers of the funds received from the governmental programs to face the crisis.
Results
The United States generated a net attributable profit of €26m during the first half of 2020, 91.6% less than in the same period of the previous year. The most relevant aspects related to the income statement are summarized below:
- Net interest income fell by 9.2% year-on-year, impacted by interest rate cuts, for a total of 225 basis points, made by the Fed since the first quarter 2019.
- Net fees and commissions closed with an increase of 2.6% compared to the same period in the previous year, due mainly to those generated by the Global Markets unit.
- NTI contribution increased (up 83.1% year-on-year) as a result of higher capital gains from the sale of ALCO portfolios and higher results from the Global Markets unit.
- Operating expenses are lower compared to the same period in the previous year (down 2.5% year-on-year) as a result of both the decrease of some expenses due to the pandemic and the containment plans which have been implemented.
- Increase in the impairment on financial assets (up 109.2% year-on-year, down 56.0% in the quarter), explained by the adjustment in the macro scenario due to the negative effects of COVID-19 and to higher loan-loss provisions in the first quarter to cover specific clients in the Oil & Gas sector. Consequently, the cumulative cost of risk as of June 2020 stood at 1.80%, after the rebound experienced in March due to the increase in the impairment on financial assets.
- The heading of provisions and other results closed at €-19m, mainly due to higher provisions as a consequence of COVID-19.
- The income tax registered an income of €11m as a result of the adjustment of the calculation of the effective tax rate for the whole year.