
Mexico
Highlights
- Evolution of activity is supported by the good performance of the wholesale portfolio.
- Growth of gross income thanks to the increase in NTI.
- Stability in operating income.
- Net attributable profit affected by the significant increase in the impairment on financial assets line.
Business activity (1)
(Year-on-year change at constant exchange rate. Data as of 30-06-20)
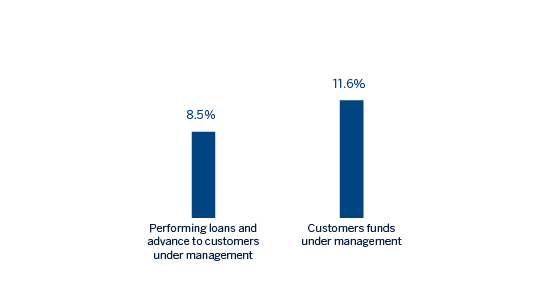
(1) Excluding repos.
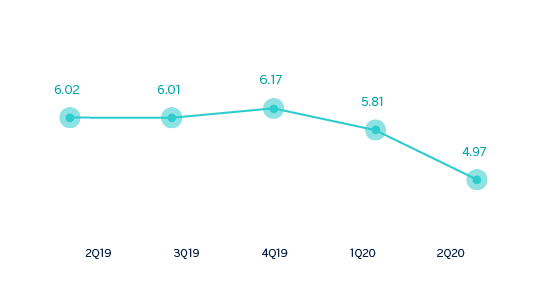
Net interest income/ATAs
(Percentage. Constant exchange rate)
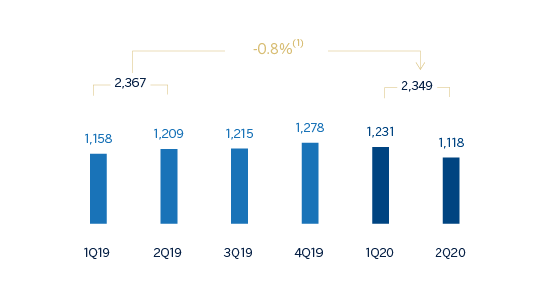
Operating income
(Millions of euros at constant exchange rate)
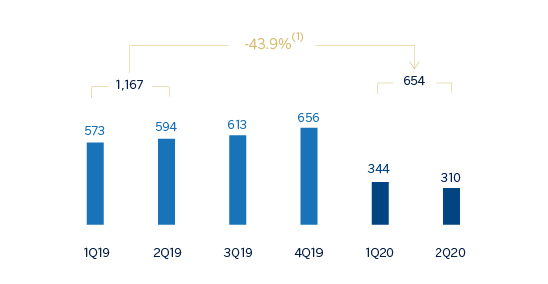
Net attributable profit
(Millions of euros at constant exchange rate)
(1) At current exchange rate: -10.0%.
(1) At current exchange rate: -49.1%.
Financial statements and relevant business indicators (Millions of euros and percentage)
| Income statement | 1H20 | ∆% | ∆% (1) | 1H19 |
|---|---|---|---|---|
| Net interest income | 2,717 | (10.7) | (1.5) | 3,042 |
| Net fees and commissions | 513 | (17.5) | (9.0) | 621 |
| Net trading income | 231 | 71.0 | 88.5 | 135 |
| Other operating income and expenses | 88 | (13.1) | (4.1) | 102 |
| Gross income | 3,550 | (9.0) | 0.4 | 3,901 |
| Operating expenses | (1,200) | (6.9) | 2.6 | (1,290) |
| Personnel expenses | (490) | (10.5) | (1.3) | (548) |
| Other administrative expenses | (551) | (3.3) | 6.7 | (570) |
| Depreciation | (159) | (7.8) | 1.6 | (172) |
| Operating income | 2,349 | (10.0) | (0.8) | 2,611 |
| Impairment on financial assets not measured at fair value through profit or loss | (1,394) | 70.5 | 88.0 | (818) |
| Provisions or reversal of provisions and other results | (64) | n.s. | n.s. | (10) |
| Profit/(loss) before tax | 891 | (50.0) | (44.9) | 1,783 |
| Income tax | (237) | (52.4) | (47.5) | (496) |
| Profit/(loss) for the year | 655 | (49.1) | (43.9) | 1,287 |
| Non-controlling interests | (0) | (49.4) | (44.2) | (0) |
| Net attributable profit | 654 | (49.1) | (43.9) | 1,287 |
| Balance sheets | 30-06-20 | ∆% | ∆% (1) | 31-12-19 |
|---|---|---|---|---|
| Cash, cash balances at central banks and other demand deposits | 6,562 | 1.1 | 23.7 | 6,489 |
| Financial assets designated at fair value | 33,941 | 8.1 | 32.2 | 31,402 |
| Of which loans and advances | 2,336 | 200.7 | 267.6 | 777 |
| Financial assets at amortized cost | 58,418 | (11.7) | 7.9 | 66,180 |
| Of which loans and advances to customers | 49,440 | (14.9) | 4.1 | 58,081 |
| Tangible assets | 1,582 | (21.7) | (4.3) | 2,022 |
| Other assets | 3,167 | 6.1 | 29.7 | 2,985 |
| Total assets/liabilities and equity | 103,671 | (5.0) | 16.2 | 109,079 |
| Financial liabilities held for trading and designated at fair value through profit or loss | 24,494 | 12.4 | 37.5 | 21,784 |
| Deposits from central banks and credit institutions | 3,096 | 46.2 | 78.8 | 2,117 |
| Deposits from customers | 50,398 | (9.9) | 10.2 | 55,934 |
| Debt certificates | 7,799 | (11.8) | 7.9 | 8,840 |
| Other liabilities | 12,535 | (19.2) | (1.2) | 15,514 |
| Economic capital allocated | 5,348 | 9.4 | 33.8 | 4,889 |
| Relevant business indicators | 30-06-20 | ∆% | ∆% (1) | 31-12-19 |
|---|---|---|---|---|
| Performing loans and advances to customers under management (2) | 50,217 | (14.3) | 4.8 | 58,617 |
| Non-performing loans | 1,194 | (19.2) | (1.2) | 1,478 |
| Customer deposits under management (3) | 50,131 | (9.4) | 10.8 | 55,331 |
| Off-balance sheet funds | 21,271 | (13.0) | 6.3 | 24,464 |
| Risk-weighted assets | 54,947 | (7.3) | 13.3 | 59,299 |
| Efficiency ratio (%) | 33.8 | 32.9 | ||
| NPL ratio (%) | 2.2 | 2.4 | ||
| NPL coverage ratio (%) | 165 | 136 | ||
| Cost of risk (%) | 4.95 | 3.01 |
(1) Figures at constant exchange rate.
(2) Excluding repos.
(3) Includes mutual funds, pension funds and other off-balance sheet funds.
Activity
Unless expressly stated otherwise, all the comments below on rates of change, for both activity and results, will be given at constant exchange rate. These rates, together with changes at current exchange rates, can be found in the attached tables of financial statements and relevant business indicators.
The most relevant developments in relation to activity in the area during the first half of 2020 have been:
- Lending activity (performing loans under management) grew by 4.8% in the first six months, supported by the performance of the wholesale portfolio, which registered an increase of 10.4%, driven by both the availability of credit facilities to deal with the pandemic and by the constant organic generation of lending. It is worth mentioning that the growth of BBVA Mexico's wholesale portfolio outperformed the market, allowing it to gain 120 basis points of market share in this segment over the last twelve months to 20.7%, according to the latest data available at the end of May (Source: Mexican National Banking and Securities Commission). The retail portfolio closed in line with December 2019 (up 0.2%), due to lower economic activity resulting from the lockdown, which affected consumer portfolios and credit cards.
- The asset quality indicators improved in comparison to the end of 2019. As a result, the NPL ratio stood at 2.2% and the NPL coverage ratio at 165%.
- Customer deposits under management grew by 10.8% in the half year, driven by the good performance of both demand deposits and time deposits. Off-balance sheet funds also performed well in the half-year (up 6.3%), due to a greater customer preference for these products in their search for more profitable investment alternatives.
Results
BBVA Mexico achieved a net attributable profit of €654m in the first half of 2020, which is a 43.9% reduction compared to the same period of the previous year. This was due to the increase in the impairment on financial assets, generated by additional provisions made during the first half of the year as a result of COVID-19. The most relevant aspects related to the income statement are summarized below:
- Net interest income closed below the first half of 2019 (down 1.5%) since higher activity levels were offset by a reduction of 225 basis points in the benchmark rates during the first half of 2020. Additionally, this reflects the change in the portfolio mix, with a higher percentage of wholesale customers, as well as the application of customer support programs.
- Net fees and commissions fell (down 9.0%), mainly as a result of lower fees and commissions for credit card transactions due to the lockdown imposed in response to the pandemic, and to an increase in transactions made through digital channels, which do not generate fees and commissions for retail customers.
- The NTI performed strongly, with an 88.5% year-on-year growth mainly derived from the earnings of the Global Markets unit, as well as higher earnings from foreign exchange transactions.
- The other operating income and expenses line registered a year-on-year fall of 4.1%, mainly due to a greater contribution to the Deposit Guarantee Fund which was partially offset by the good performance of the insurance business.
- The impairment on financial assets line item increased by 88.0%, mainly due to the additional provisions caused by COVID-19, which include the deterioration in the macroeconomic scenario. The cumulative cost of risk as of June 2020 was 4.95%.
- In the provisions and other results line, the comparison was negative due to higher provisions for contingencies resulting from COVID-19.