
Turkey
Highlights
- Activity impacted by the support programs and lockdown.
- Good performance of net interest income and NTI.
- Efficiency ratio improvement.
- Net attributable profit affected by the significant increase in the impairment on financial assets line.
Business activity (1)
(Year-on-year change at constant exchange rate. Data as of 30-06-20)
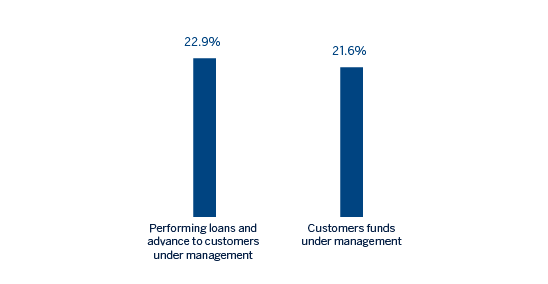
(1) Excluding repos.
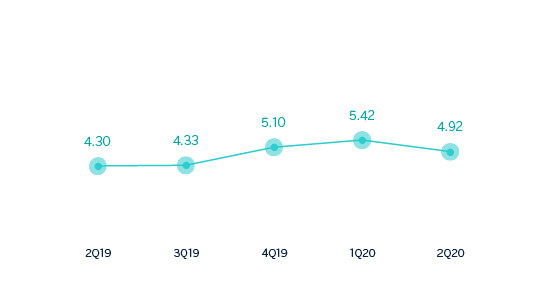
Net interest income/ATAs
(Percentage. Constant exchange rate)
Operating income
(Millions of euros at constant exchange rate)

(1) At current exchange rate: +28.7%.
Net attributable profit
(Millions of euros at constant exchange rate)
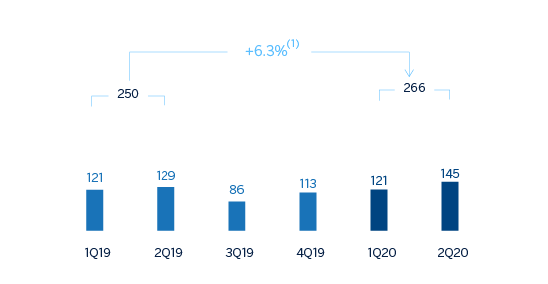
(1) At current exchange rate: -5.5%
Financial statements and relevant business indicators (Millions of euros and percentage)
| Income statement | 1H20 | ∆% | ∆% (1) | 1H19 |
|---|---|---|---|---|
| Net interest income | 1,534 | 13.4 | 27.6 | 1,353 |
| Net fees and commissions | 264 | (26.7) | (17.5) | 360 |
| Net trading income | 127 | n.s. | n.s. | (65) |
| Other operating income and expenses | 32 | 8.0 | 21.6 | 30 |
| Gross income | 1,957 | 16.7 | 31.3 | 1,677 |
| Operating expenses | (562) | (5.3) | 6.6 | (594) |
| Personnel expenses | (307) | (8.4) | 3.0 | (335) |
| Other administrative expenses | (172) | (0.3) | 12.2 | (173) |
| Depreciation | (83) | (3.1) | 9.1 | (86) |
| Operating income | 1,394 | 28.7 | 44.8 | 1,084 |
| Impairment on financial assets not measured at fair value through profit or loss | (618) | 83.6 | 106.5 | (337) |
| Provisions or reversal of provisions and other results | (61) | 186.5 | 222.4 | (21) |
| Profit/(loss) before tax | 715 | (1.4) | 10.9 | 726 |
| Income tax | (175) | 14.7 | 29.1 | (153) |
| Profit/(loss) for the year | 540 | (5.7) | 6.1 | 573 |
| Non-controlling interests | (274) | (5.9) | 5.9 | (291) |
| Net attributable profit | 266 | (5.5) | 6.3 | 282 |
| Balance sheets | 30-06-20 | ∆% | ∆% (1) | 31-12-19 |
|---|---|---|---|---|
| Cash, cash balances at central banks and other demand deposits | 5,489 | 0.1 | 14.9 | 5,486 |
| Financial assets designated at fair value | 5,712 | 8.4 | 24.5 | 5,268 |
| Of which loans and advances | 454 | 2.1 | 17.3 | 444 |
| Financial assets at amortized cost | 50,079 | (2.4) | 12.1 | 51,285 |
| Of which loans and advances to customers | 41,196 | 1.7 | 16.8 | 40,500 |
| Tangible assets | 942 | (15.7) | (3.2) | 1,117 |
| Other assets | 1,302 | 3.4 | 18.8 | 1,260 |
| Total assets/liabilities and equity | 63,525 | (1.4) | 13.2 | 64,416 |
| Financial liabilities held for trading and designated at fair value through profit or loss | 2,249 | 3.0 | 18.3 | 2,184 |
| Deposits from central banks and credit institutions | 5,572 | 24.6 | 43.0 | 4,473 |
| Deposits from customers | 40,132 | (2.9) | 11.5 | 41,335 |
| Debt certificates | 4,074 | (4.6) | 9.5 | 4,271 |
| Other liabilities | 8,751 | (7.7) | 6.0 | 9,481 |
| Economic capital allocated | 2,748 | 2.8 | 18.1 | 2,672 |
| Relevant business indicators | 30-06-20 | ∆% | ∆% (1) | 31-12-19 |
|---|---|---|---|---|
| Performing loans and advances to customers under management (2) | 40,529 | 2.2 | 17.3 | 39,662 |
| Non-performing loans | 3,708 | 1.2 | 16.2 | 3,663 |
| Customer deposits under management (2) | 39,929 | (3.4) | 11.0 | 41,324 |
| Off-balance sheet funds (3) | 4,212 | 7.8 | 23.8 | 3,906 |
| Activos ponderados por riesgo | 57,190 | 1.0 | 15.9 | 56,642 |
| Efficiency ratio (%) | 28.7 | 33.8 | ||
| NPL ratio (%) | 7.0 | 7.0 | ||
| NPL coverage ratio (%) | 82 | 75 | ||
| Cost of risk (%) | 2.71 | 2.07 |
(1) Figures at constant exchange rate.
(2) Excluding repos.
(3) Includes mutual funds, pension funds and other off-balance sheet funds.
Activity
Unless expressly stated otherwise, all comments below on rates of changes for both activity and income, will be presented at constant exchange rates. These rates, together with changes at current exchange rates, can be observed in the attached tables of the financial statements and relevant business indicators.
The most relevant aspects related to the area’s activity during the first six months of 2020 were:
- Lending activity (performing loans under management) increased by 17.3% year-to-date mainly driven by a growth in Turkish lira loans (up 22.0%) which was supported by a lower interest rate environment, commercial customers supported by the Credit Guarantee Fund (hereafter CGF) lending and short-term commercial lending. Foreign-currency loans (in U.S. dollars) remained stable during the first half of 2020 (up 0.4%).
- By segments, Turkish-lira commercial loans performed remarkably well in the first half of 2020 (up 43.0%) mainly thanks to new CGF utilizations and declining interest rates. In addition, consumer loans continued growing at double digit in the first half of 2020, thanks to the good origination at the end of the second quarter after the significant increase in the first quarter, and credit cards, which slightly recovered in the second quarter of the year showing an increase in the first half of 2020.
- In terms of asset quality, the NPL ratio remained stable at 7.0% compared to December 2019. The NPL coverage ratio stood at 82% as of June 30, 2020.
- Customer deposits (63% of total liabilities in the area as of June 30, 2020) remained the main source of funding for the balance sheet and increased by 11.0% in the first half of 2020. It is worth mentioning the positive performance of demand deposits which represent 49.2% of the total customer deposits and which increased by 43.5% between January and June 2020, as well as the off-balance sheet funds which grew by 23.8% during the same time.
Results
Turkey generated a net attributable profit of €266m in the first half of 2020, 6.3% higher than the same period of the previous year. Despite the impact from the increase in the impairment losses on financial assets, operating income grew by 44.8%. The most significant aspects of the year-on-year evolution in the income statement are the following:
- Net interest income grew (up 27.6%) mainly due to higher Turkish lira customer spreads and higher loan and demand deposit volume, which was partially offset by a lower contribution from inflation-linked bonds.
- Net fees and commissions contracted by 17.5% on a year-on-year basis, mainly due to the changes in fees regulation that went into effect in March 2020 and lower activity levels due to the impact of COVID-19.
- NTI performed well in the first half of 2020 and compares favorably with the losses of the first half of 2019. This is mainly the result of the good performance of hedging activities, foreign currency trading operations and the income generated by security trading operations.
- Other operating income and expenses increased by 21.6% compared to the same period in 2019, mainly due to positive contribution of non-financial activities (renting activity) and higher insurance activity income.
- Operating expenses increased by 6.6%, significantly below the average inflation rate which is also supported by the reduction in the operating expenses due to COVID-19. As a result of the growth of the gross margin well above the growth of expenses, the efficiency ratio remained at low levels (28.7%).
- Impairment losses on financial assets strongly increased by 106.5% because of provisions for specific clients in the commercial portfolio and, especially, the adjustment in the macro scenario due to the negative effects of COVID-19. For its part, the cumulative cost of risk at the end of June stood at 2.71% after its upturn in March as a result of the growing loan loss provisions.
- The line provisions and other results closed the first half of 2020 at -€61m and compares adversely to the same period of the previous year mainly due to higher provisions for special funds and for contingent liabilities and commitments.