
South America
Highlights
- Activity affected by the support programs and the lockdown.
- Year-on-year net interest income growth.
- Reduction in NTI and net fees and commissions.
- Net attributable profit affected by the increase in the impairment on financial assets line.
Business activity (1)
(Year-on-year change at constant exchange rates. Data as of 30-06-20)
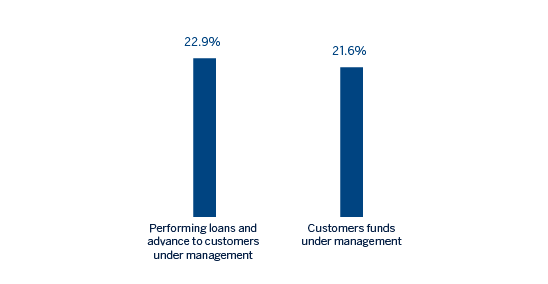
(1) Excluding repos.
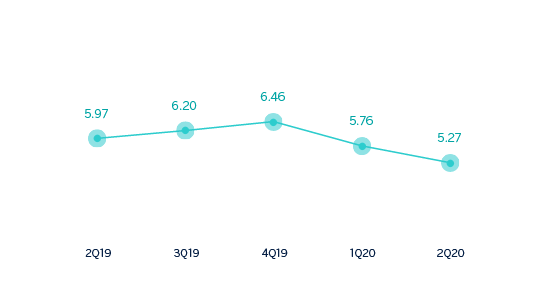
Net interest income/ATAs
(Percentage. Constant exchange rates)
Operating income
(Millions of euros at constant exchange rates)
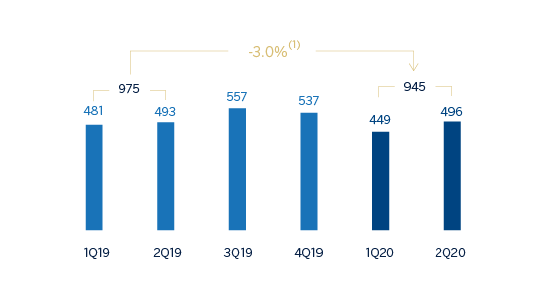
(1) At current exchange rate: -22.2%.
Net attributable profit
(Millions of euros at constant exchange rates)
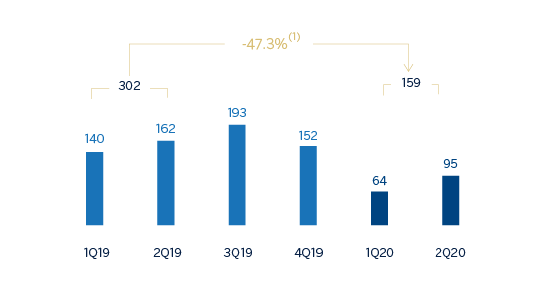
(1) At current exchange rate: -60.6%
Financial statements and relevant business indicators (Millions of euros and percentage)
| Income statement | 1H20 | ∆% | ∆% (1) | 1H19 |
|---|---|---|---|---|
| Net interest income | 1,443 | (10.5) | 6.8 | 1,613 |
| Net fees and commissions | 232 | (22.3) | (9.9) | 298 |
| Net trading income | 172 | (45.3) | (30.2) | 314 |
| Other operating income and expenses | (183) | (21.0) | (16.3) | (231) |
| Gross income | 1,664 | (16.6) | 1.7 | 1,994 |
| Operating expenses | (719) | (7.7) | 8.5 | (779) |
| Personnel expenses | (357) | (11.2) | 6.1 | (402) |
| Other administrative expenses | (279) | (4.7) | 11.6 | (293) |
| Depreciation | (83) | (1.8) | 9.2 | (84) |
| Operating income | 945 | (22.2) | (3.0) | 1,215 |
| Impaiment on financial assets not measured at fair value through profit or loss | (603) | 72.5 | 96.3 | (349) |
| Provisions or reversal of provisions and other results | (45) | 139.1 | 279.9 | (19) |
| Profit/(loss) before tax | 297 | (64.9) | (54.7) | 847 |
| Income tax | (81) | (70.0) | (62.8) | (271) |
| Profit/(loss) for the year | 216 | (62.5) | (50.7) | 576 |
| Non-controlling interests | (57) | (67.0) | (58.1) | (171) |
| Net attributable profit | 159 | (60.6) | (47.3) | 404 |
| Balance sheets | 30-06-20 | ∆% | ∆% (1) | 31-12-19 |
|---|---|---|---|---|
| Cash, cash balances at central banks and other demand deposits | 8,399 | (2.3) | 8.0 | 8,601 |
| Financial assets designated at fair value | 8,250 | 34.8 | 50.1 | 6,120 |
| Of which loans and advances | 452 | 296.8 | n.s. | 114 |
| Financial assets at amortized cost | 38.742 | 2.3 | 12.6 | 37.869 |
| Of which loans and advances to customers | 35.336 | (1.0) | 9.0 | 35.701 |
| Tangible assets | 874 | (9.7) | (3.9) | 968 |
| Other assets | 1,626 | 13.0 | 23.7 | 1,438 |
| Total assets/liabilities and equity | 57.891 | 5.3 | 16.0 | 54.996 |
| Financial liabilities held for trading and designated at fair value through profit or loss | 1,943 | 4.5 | 18.8 | 1,860 |
| Deposits from central banks and credit institutions | 4,289 | 17.3 | 26.9 | 3,656 |
| Deposits from customers | 39.357 | 9.0 | 20.4 | 36.104 |
| Debt certificates | 2,972 | (7.7) | 0.2 | 3,220 |
| Other liabilities | 6,998 | (8.7) | (0.3) | 7,664 |
| Economic capital allocated | 2,332 | (6.4) | 4.3 | 2,492 |
| Relevant business indicators | 30-06-20 | ∆% | ∆% (1) | 31-12-19 |
|---|---|---|---|---|
| Performing loans and advances to customers under management (2) | 35.273 | (0.9) | 9.1 | 35.598 |
| Non-performing loans | 1,888 | 1.9 | 12.3 | 1,853 |
| Customer deposits under management (3) | 39.376 | 9.0 | 20.4 | 36.123 |
| Off-balance sheet funds (4) | 13.838 | 7.6 | 10.5 | 12.864 |
| Risk-weighted assets | 44,015 | (3.1) | 6.7 | 45.413 |
| Efficiency ratio (%) | 43,2 | 40,9 | ||
| NPL ratio (%) | 4,5 | 4,4 | ||
| NPL coverage ratio (%) | 108 | 100 | ||
| Cost of risk (%) | 3,10 | 1,88 |
- (1) Figures at constant exchange rates.
- (2) Excluding repos.
- (3) Excluding repos and including specific marketable debt securities.
- (4) Includes mutual funds, pension funds and other off-balance sheet funds.
South America. Data per country (Millions of euros)
| Operating income | Net attributable profit/(loss) | |||||||
|---|---|---|---|---|---|---|---|---|
| Country | 1H20 | ∆% | ∆% (1) | 1H19 | 1H20 | ∆% | ∆% (1) | 1H19 |
| Argentina | 190 | (43.4) | n.s. | 335 | 43 | (61.2) | n.s. | 110 |
| Colombia | 295 | (10.7) | 0.8 | 331 | 48 | (63.0) | (58.2) | 130 |
| Peru | 353 | (13.7) | (13.5) | 409 | 32 | (66.8) | (66.7) | 98 |
| Other countries (2) | 107 | (23.4) | (12.7) | 140 | 36 | (45.9) | (37.6) | 66 |
| Total | 945 | (22.2) | (3.0) | 1,215 | 159 | (60.6) | (47.3) | 404 |
- (1) Figures at constant exchange rates.
- (2) Bolivia, Chile (Forum), Paraguay, Uruguay and Venezuela. Additionally, it includes eliminations and other charges.
South America. Relevant business indicators per country (Millions of euros)
| Argentina | Colombia | Peru | ||||
|---|---|---|---|---|---|---|
| 30-06-20 | 31-12-19 | 30-06-20 | 31-12-19 | 30-06-20 | 31-12-19 | |
| Performing loans and advances to customers under management (1) (2) | 3.172 | 2.500 | 11.885 | 11.242 | 16.017 | 14.168 |
| Non-performing loans and guarantees given (1) | 67 | 89 | 688 | 648 | 914 | 760 |
| Customer deposits under management (1) (3) | 4,731 | 3,726 | 13,582 | 11,104 | 16,407 | 13,802 |
| Off-balance sheet funds (1) (4) | 1.455 | 550 | 1,140 | 1,215 | 1,887 | 1,716 |
| Risk-weighted assets | 6,354 | 6,093 | 13,499 | 14,172 | 18,735 | 19,293 |
| Efficiency ratio (%) | 53.3 | 46.9 | 35.6 | 36.2 | 39.1 | 35.8 |
| NPL ratio (%) | 2.1 | 3.4 | 5.3 | 5.3 | 4.4 | 4.1 |
| NPL coverage ratio (%) | 205 | 161 | 110 | 98 | 105 | 96 |
| Cost of risk (%) | 3.64 | 4.22 | 3.37 | 1.67 | 2.91 | 1.45 |
- (1) Figures at constant exchange rates.
- (2) Excluding repos.
- (3) Excluding repos and including specific marketable debt securities.
- (4) Includes mutual funds and other off-balance sheet funds.
Activity and results
Unless expressly stated otherwise, all the comments below on rates of change, for both activity and results, will be given at constant exchange rates. These rates, together with the changes at current exchange rates, can be found in the attached tables of the financial statements and relevant business indicators.
The most relevant aspects related to the area's activity during the first half of 2020 were:
- Lending activity (performing loans under management) as of June 30, 2020 was 9.1% higher than at the end of the previous year. The performance of the wholesale portfolio is noteworthy, due to greater drawdowns of credit facilities by companies in response to the situation generated by the COVID-19 health crisis. This positive performance was partly offset by the lower activity of retail customers caused by the lockdown measures applied by the different countries and which has particularly affected consumer portfolios and credit cards. With regards to asset quality, the NPL ratio stood at 4.5%, while the NPL coverage ratio stood at 108%.
- On the funding side, the performance has been boosted by the measures taken by the different central banks to ensure liquidity in the respective financial systems in the region. As a result, deposits from customers under management increased by 20.4% during the first six months of the year, mainly due to the growth of demand deposits and, to a lesser extent, time deposits. For its part, off-balance sheet funds grew by 10.5% in the same period.
Regarding results, South America generated a cumulative net attributable profit of €159m between January and June 2020, representing a year-on-year decline of -47.3% (down 60.6% at current exchange rates), mainly due to the increase in the impairment on financial assets caused by the COVID-19 crisis. The cumulative impact of inflation in Argentina on the area's net attributable profit in the first half of 2020 amounted to -€58m, compared to -€94m in the first half of 2019.
The most notable aspects of the evolution of the income statement in the first half of 2020 are summarized below:
- Net interest income continued to grow at constant exchange rates (up 6.8%). At current exchange rates, the depreciation of the main currencies in the region weakened this positive performance.
- Decrease in the contribution from NTI (down 30.2% at constant exchange rates, down 45.3% at current exchange rates) mainly due to the positive effect of the sale of the stake in Prisma Medios de Pago S.A. in the first half of 2019.
- Increase in operating expenses below the inflation rate in the region.
- Higher impairment on financial assets (up 96.3%, up 72.5% at current exchange rates) mainly due to the extraordinary deterioration in the macroeconomic scenario caused by the impact of COVID-19.
The most significant countries in the business area, Argentina, Colombia and Peru, performed as follows in the first half of 2020 in terms of activity and results:
Argentina
- Lending activity grew by 26.9% in the first six months due to the increase in wholesale portfolios, partly offset by lower retail growth, especially in consumer finance and credit cards, as a result of the reduced activity resulting from the COVID-19 lockdown measures. The NPL ratio decreased to 2.1% as of June 30, 2020, down from 3.4% at the end of December 2019, as a result of decreasing non-performing loans.
- On the funding side, deposits from customers under management increased by 26.9%, with strong growth in both time and demand deposits due to the establishment of minimum returns for deposits in pesos by the Central Bank of the Republic of Argentina.
- Net attributable profit stood at €43m, affected by the greater need for impairment on financial assets resulting from the COVID-19 crisis and by the positive effect of the sale of the stake in Prisma Medios de Pago S.A. on the results for the previous year.
Colombia
- Lending activity grew by 5.7% during the first six months due to the performance of the wholesale portfolios, which offset the lower growth in retail, especially in consumer finance and credit cards, resulting from the lower activity caused by the lockdown. In terms of asset quality, the NPL ratio remained stable at 5.3% at the end of June 2020.
- Deposits from customers under management increased by 22.3% in the first six months of 2020, driven by the growth in demand and time deposits. Off-balance sheet funds continued their recovery after the withdrawals seen at the end of the first quarter of the year and closed 6.2% lower compared to the end of December 2019 (up 56.5% in the quarter).
- The net attributable profit stood at €48m, with a year-on-year fall of 58.2%. Greater generation of net interest income but a negative impact from the greater loan-loss provisioning due to the COVID-19 crisis, as well as the provisions for specific customers.
Peru
- Lending activity was 13.0% above the end of the financial year 2019, mainly driven by the wholesale portfolio, due to the distribution of funds from the Plan Reactiva (Reactive Plan), which offsets the lower retail growth, especially in consumer finance and credit cards, as a result of the reduced activity caused by the COVID-19 lockdown. With regard to asset quality, the NPL ratio increased to 4.4% as of June 30, 2020 and the NPL coverage ratio reached 105%.
- Deposits from customers under management increased by 18.9% in the half, mainly due to the 32.9% growth in demand deposits. Off-balance sheet funds increased by 9.9%.
- Net interest income fell compared to the previous year, due to the pressure on interest rates caused by the fall in official rates and government-backed loans at preferential rates, which are in addition to the customer relief measures such as interest-free deferral of repayments on credit cards. Net fees and commissions also fell, affected by the reduced activity resulting from the pandemic and the elimination of certain fees and commissions as a measure to support customers. Significant increase in the impairment on financial assets as a result of greater loan-loss provisioning resulting from the COVID-19 crisis. As a result of the above, the net attributable profit stood at €32m, which is 66.7% lower than the figure achieved twelve months earlier.