
Rest of Business
Highlights
- Slight increase in lending and a decrease in customers funds in the quarter.
- NPL ratio contained.
- Net interest income growth and good performance of NTI.
- Reduction of operating expenses.
Business activity (1)
(YEAR-TO-DATE CHANGE)

(1) Excluding repos.
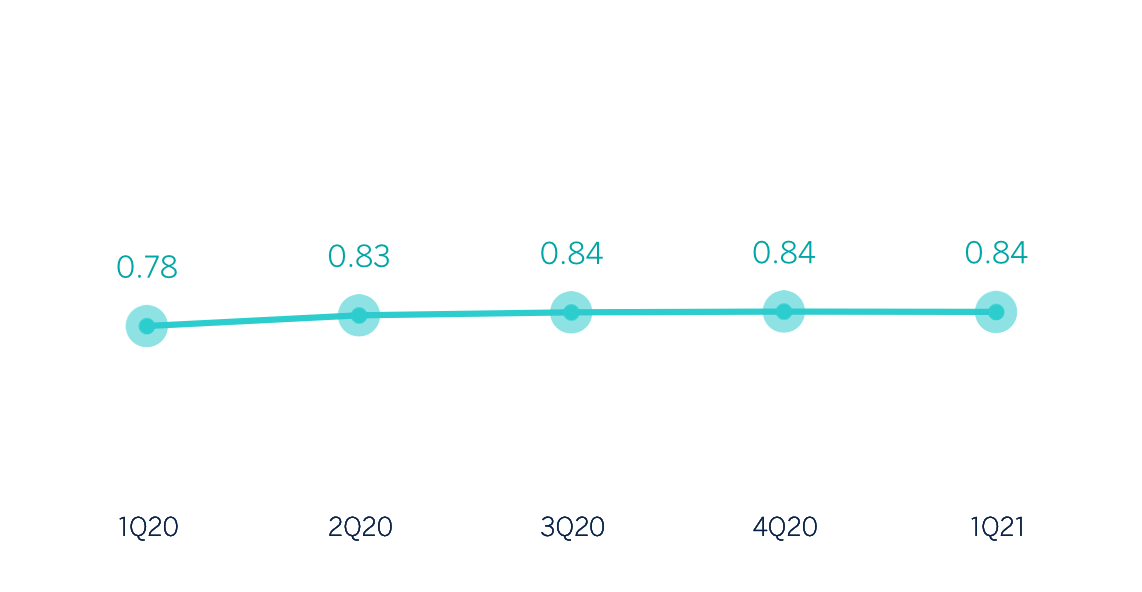
Net interest income/ATAs
(Percentage. Constant exchange rate)
Operating income
(Millions of euros at constant exchange rate)

(1) At current exchange rate: +20.2%.
Net attributable profit
(Millions of euros at constant exchange
rate)

(1) At current exchange rate: -10.8%.
Financial statements and relevant business indicators (Millions of euros and percentage)
| Income statement | 1Q21 | ∆% | ∆% (1) | 1Q20 |
|---|---|---|---|---|
| Net interest income | 72 | 11.6 | 13.7 | 65 |
| Net fees and commissions | 73 | (13.2) | (9.1) | 84 |
| Net trading income | 65 | 29.5 | 32.0 | 50 |
| Other operating income and expenses | 8 | (30.2) | (25.2) | 12 |
| Gross income | 218 | 3.6 | 7.0 | 211 |
| Operating expenses | (115) | (7.9) | (4.6) | (125) |
| Personnel expenses | (64) | (12.7) | (8.8) | (73) |
| Other administrative expenses | (46) | (0.1) | 2.4 | (46) |
| Depreciation | (5) | (9.5) | (8.1) | (5) |
| Operating income | 103 | 20.2 | 23.7 | 86 |
| Impaiment on financial assets not measured at fair value through profit or loss | 2 | n.s. | n.s. | (9) |
| Provisions or reversal of provisions and other results | (12) | n.s. | n.s. | 11 |
| Profit/(loss) before tax | 93 | 5.5 | 8.1 | 88 |
| Income tax | (17) | (12.7) | (10.7) | (20) |
| Profit/(loss) for the year | 75 | 10.8 | 13.6 | 68 |
| Non-controlling interests | - | - | - | - |
| Net attributable profit | 75 | 10.8 | 13.6 | 68 |
| Balance sheets | 31-03-21 | ∆% | ∆% (1) | 31-12-20 |
|---|---|---|---|---|
| Cash, cash balances at central banks and other demand deposits | 5,509 | (10.0) | (13.8) | 6,121 |
| Financial assets designated at fair value | 2,145 | 45.9 | 41.6 | 1,470 |
| Of which: Loans and advances | 825 | n.s. | n.s. | 153 |
| Financial assets at amortized cost | 27,950 | 2.7 | 1.9 | 27,213 |
| Of which: Loans and advances to customers | 24,450 | 1.8 | 0.9 | 24,015 |
| Inter-area positions | - | - | - | - |
| Tangible assets | 73 | (3.1) | (3.6) | 75 |
| Other assets | 339 | 15.6 | 14.0 | 293 |
| Total assets/liabilities and equity | 36,015 | 2.4 | 0.8 | 35,172 |
| Financial liabilities held for trading and designated at fair value through profit or loss | 1,509 | 77.8 | 70.3 | 849 |
| Deposits from central banks and credit institutions | 1,553 | (8.7) | (10.7) | 1,700 |
| Deposits from customers | 6,764 | (27.5) | (29.0) | 9,333 |
| Debt certificates | 1,127 | (25.4) | (26.0) | 1,511 |
| Inter-area positions | 21,499 | 18.6 | 17.2 | 18,132 |
| Other liabilities | 563 | (7.4) | (8.6) | 608 |
| Economic capital allocated | 2,999 | (1.3) | (2.6) | 3,039 |
| Relevant business indicators | 31-03-21 | ∆% | ∆% (1) | 31-12-20 |
|---|---|---|---|---|
| Performing loans and advances to customers under management (2) | 24,446 | 1.7 | 0.7 | 24,038 |
| Non-performing loans | 331 | 2.1 | 1.7 | 324 |
| Customer deposits under management (2) | 6,764 | (27.5) | (29.0) | 9,333 |
| Off-balance sheet funds (3) | 530 | (7.0) | (7.0) | 569 |
| Risk-weighted assets | 28,436 | 16.9 | 15.6 | 24,331 |
| Efficiency ratio (%) | 52.6 | 55.6 | ||
| NPL ratio (%) | 1.0 | 1.0 | ||
| NPL coverage ratio (%) | 101 | 109 | ||
| Cost of risk (%) | (0.03) | 0.30 |
(1) Figures at constant exchange rates.
(2) Excluding repos.
(2) Includes pension funds.
Unless expressly stated otherwise, all the comments below on rates of change, for both activity and results, will be given at constant exchange rate. These rates, together with changes at current exchange rates, can be found in the attached tables of financial statements and relevant business indicators.
Activity and results
The most relevant aspects of the activity and results of the Rest of Business of the BBVA Group during the first quarter of 2021 were:
- Lending activity (performing loans under management) increased slightly during the first quarter of the year (up 0.7%).
- Regarding credit risk indicators, the NPL ratio stood at 1.0%, remaining stable with respect to December 2020, and the NPL coverage ratio decreased to 101%.
- Customer deposits under management fell by 29.0%, mainly due to a decrease in deposits from wholesale customers in Europe, excluding Spain, and the New York branch.
- In terms of results, net interest income increased 13.7% compared to the same period last year mainly due to the evolution of the branches located in Asia.
- The NTI line increased (up 32.0% year-on-year) on the back of the excellent performance of customer activity.
- Reduction of operating expenses (down 4.6% year-on-year) as a result of the active management of personnel costs and the focus on the implementation of control measures.
- The line of impairment on financial assets closed at €2m, which compares positively with the €-9m recorded twelve months earlier.
- The provisions and other results line stood at €-12m, mainly due to allowances for risks and contingent commitments.
- As a result, the area's cumulative net attributable profit at the end of March 2021 was €75m (up 13.6% year-on-year).