
Turkey
Highlights
- Activity growth driven by Turkish lira loans and deposits.
- Outstanding performance of NTI and net fees.
- Operating expenses growth in line with the average inflation.
- Net attributable profit growth driven by lower impairment losses on financial assets in a comparative affected by the outbreak of the pandemic.
Business activity (1)
(YEAR-TO-DATE CHANGE)
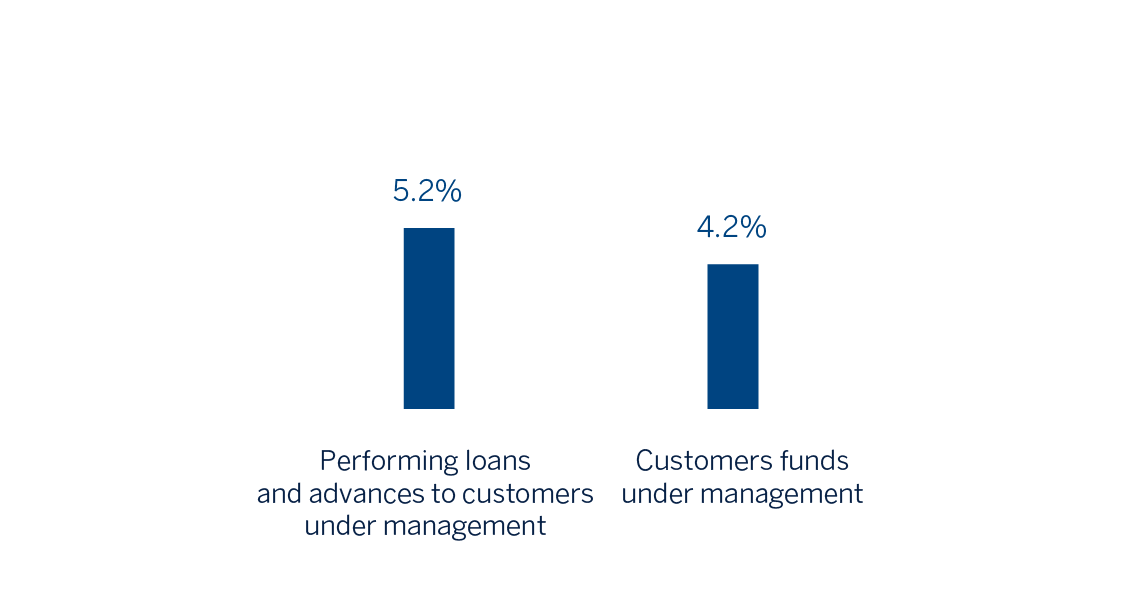
(1) Excluding repos.
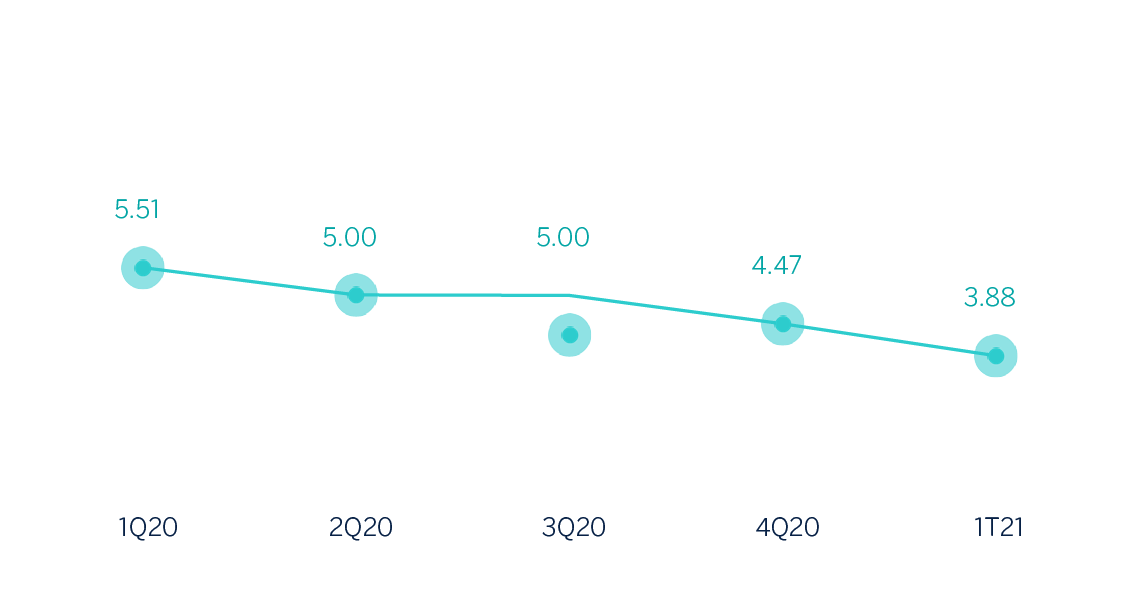
Net interest income/ATAs
(Percentage. Constant exchange rate)
Operating income
(Millions of euros at constant exchange rate)
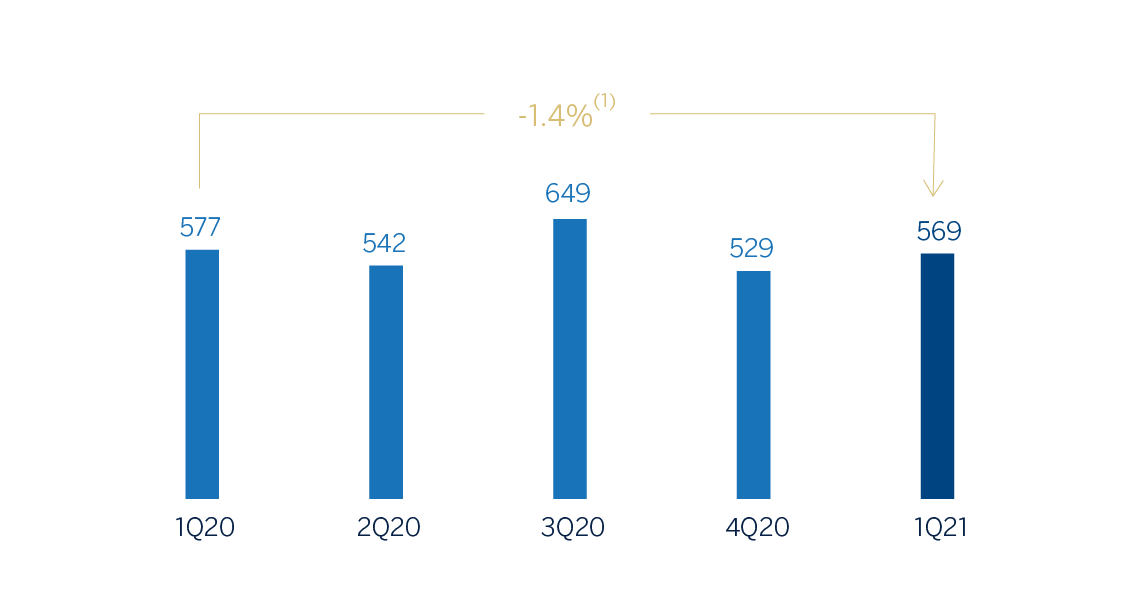
(1) At current exchange rate: -25.5%
Net attributable profit
(Millions of euros at constant exchange rate)
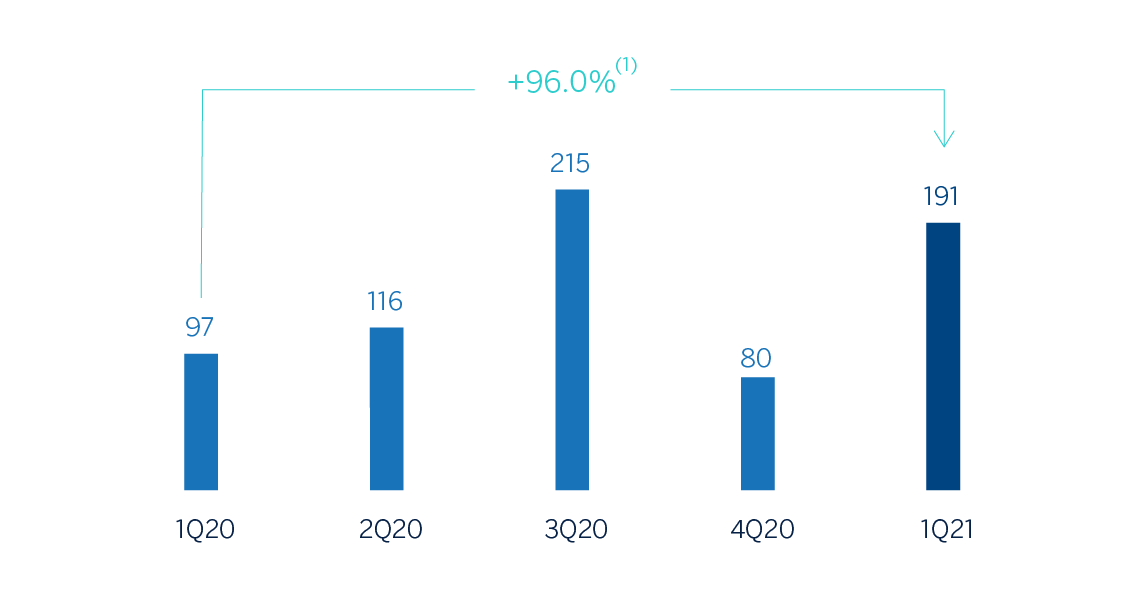
(1) At current exchange rate: +48.2%
Financial statements and relevant business indicators (Millions of euros and percentage)
| Income statement | 1Q21 | ∆% | ∆% (1) | 1Q20 |
|---|---|---|---|---|
| Net interest income | 530 | (35.4) | (14.6) | 819 |
| Net fees and commissions | 154 | (6.5) | 23.7 | 165 |
| Net trading income | 126 | 87.9 | 148.5 | 67 |
| Other operating income and expenses | 24 | 11.8 | 47.8 | 22 |
| Gross income | 834 | (22.3) | 2.8 | 1,073 |
| Operating expenses | (265) | (14.5) | 13.1 | (310) |
| Personnel expenses | (142) | (9.5) | 19.6 | (157) |
| Other administrative expenses | (89) | (15.1) | 12.2 | (105) |
| Depreciation | (34) | (29.4) | (6.7) | (48) |
| Operating income | 569 | (25.5) | (1.4) | 763 |
| Impairment on financial assets not measured at fair value through profit or loss | (123) | (69.5) | (59.7) | (403) |
| Provisions or reversal of provisions and other results | 35 | n.s. | n.s. | (20) |
| Profit/(loss) before tax | 481 | 41.5 | 87.1 | 340 |
| Income tax | (94) | 20.0 | 58.7 | (78) |
| Profit/(loss) for the year | 387 | 48.0 | 95.6 | 262 |
| Non-controlling interests | (196) | 47.7 | 95.3 | (133) |
| Net attributable profit | 191 | 48.2 | 96.0 | 129 |
| Balance sheets | 31-03-21 | ∆% | ∆% (1) | 31-12-20 |
|---|---|---|---|---|
| Cash, cash balances at central banks and other demand deposits | 6,682 | 22.0 | 30.2 | 5,477 |
| Financial assets designated at fair value | 5,492 | 3.0 | 9.9 | 5,332 |
| Of which loans and advances | 434 | 4.7 | 11.7 | 415 |
| Financial assets at amortized cost | 44,633 | (4.4) | 2.0 | 46,705 |
| Of which loans and advances to customers | 36,859 | (1.2) | 5.5 | 37,295 |
| Tangible assets | 871 | (3.3) | 3.2 | 901 |
| Other assets | 1,197 | 2.3 | 9.2 | 1,170 |
| Total assets/liabilities and equity | 58,876 | (1.2) | 5.4 | 59,585 |
| Financial liabilities held for trading and designated at fair value through profit or loss | 2,062 | (11.7) | (5.8) | 2,336 |
| Deposits from central banks and credit institutions | 4,671 | 38.2 | 47.5 | 3,381 |
| Deposits from customers | 38,089 | (3.2) | 3.3 | 39,353 |
| Debt certificates | 4,243 | 5.1 | 12.2 | 4,037 |
| Other liabilities | 3,365 | (21.9) | (16.7) | 4,308 |
| Economic capital allocated | 6,446 | 4.5 | 11.5 | 6,170 |
| Relevant business indicators | 31-03-21 | ∆% | ∆% (1) | 31-12-20 |
|---|---|---|---|---|
| Performing loans and advances to customers under management (2) | 36,126 | (1.4) | 5.2 | 36,638 |
| Non-performing loans | 3,332 | 4.7 | 11.7 | 3,183 |
| Customer deposits under management (2) | 38,087 | (3.2) | 3.3 | 39,346 |
| Off-balance sheet funds (3) | 3,667 | 7.1 | 14.3 | 3,425 |
| Risk-weighted assets | 53,252 | 0.4 | 7.2 | 53,021 |
| Efficiency ratio (%) | 31.8 | 28.8 | ||
| NPL ratio (%) | 6.9 | 6.6 | ||
| NPL coverage ratio (%) | 78 | 80 | ||
| Cost of risk (%) | 1.34 | 2.13 |
(1) Figures at constant exchange rate.
(2) Excluding repos.
(3) Includes mutual funds and other off-balance sheet funds.
Unless expressly stated otherwise, all comments below on rates of changes for both activity and income, will be presented at constant exchange rates. These rates, together with changes at current exchange rates, can be observed in the attached tables of the financial statements and relevant business indicators.
Activity
The most relevant aspects related to the area’s activity during the first quarter of 2021 were:
- Lending activity (performing loans under management) increased by 5.2% year-to-date driven by a growth in Turkish lira loans (up 5.9%) which was supported by consumer loans, thanks to the strong origination in General Purpose Loans, but also by credit cards, mortgages at attractive yields and commercial loans. Foreign-currency loans (in U.S. dollars) contracted during the first quarter of 2021 (down 5.5%).
- In terms of asset quality, the NPL ratio increased 31 basis points to 6.9% from December 2020 due to higher NPL entries. The NPL coverage ratio stood at 78% as of March 31, 2021.
- Customer deposits under management (65% of total liabilities in the area as of March 31, 2021) remained as the main source of funding for the balance sheet and increased by 3.3% year-to-date. It is worth mentioning the positive performance of Turkish lira demand deposits (up 10.1%) year-to-date and now represent 27% of total Turkish lira customer deposits, as well as the off-balance sheet funds which grew by 14.3% during the same period. In-line with the sector trend, foreign currency deposits contracted (down 6.4% year-to-date). There was a slide from foreign currency to Turkish lira deposits due to the higher interest rate environment.
Results
Turkey generated a net attributable profit of €191m in the first quarter of 2021, 96.0% higher than the same period of the previous year. The most significant aspects of the year-on-year evolution in the income statement are the followings:
- Net interest income declined (down -14.6%) mainly due to contraction in customer spreads and increasing funding costs despite higher loan volume and higher contribution from inflation-linked bonds.
- Net fees and commissions grew significantly by 23.7% on a year-on-year basis mainly driven by the positive performance in brokerage and payment systems fees; particularly merchant fees.
- NTI performed significantly well (up 148.5%), which contributed €126m in the first quarter of 2021. This is mainly due to the positive impact of the trading operations in foreign currencies, security trading gains and derivative transactions.
- Other income increased by 47.8% compared to the same period of 2020, mainly due to the positive contribution of non-financial activities (renting activity).
- Operating expenses increased by 13.1%, in line with the average inflation rate. This increase is also impacted by the depreciation of the Turkish Lira while on the other hand, there was a reduction in some discretionary expenses due to COVID-19. The efficiency ratio remained low (31.8%).
- Impairment losses on financial assets decreased by -59.7% compared to the first quarter of 2020 which was affected by the outbreak of the pandemic. In the first quarter of 2021, lower provision requirements for some big tickets and good recovery of wholesale clients were registered. As a result of all the aforementioned, the cost of risk decreased to 1.34%.
- The line provisions and other results closed the first quarter of 2021 with a profit of €35m, which was €-20m in the same period of previous year, mainly thanks to real estate sales gains and lower provisions for special funds and for contingent liabilities and commitments.