Business areas
Spain
€1,646 Mill.*
+8.9%
Year on year changes. Balances as of 31-03-21.
Highlights
- Decrease in lending activity and customers funds.
- Improved efficiency ratio.
- Favorable year-on-year evolution for the main margins.
- Sustainable alternative for all products.
Results
Net interest income
867Gross income
1,646Operating income
893Net attributable profit
381Activity (1)
Performing loans and advances to customers under mangement
-1.2%
Customers funds under management
-3.0%
Risks
NPL coverage ratio
NPL ratio
Cost of risk
(1) Excluding repos.
(2) Year on year changes.
Mexico
€1,761 Mill.*
-1.9%
Year on year changes. Balances as of 31-03-21.
Highlights
- Activity increased in the quarter: lending activity recovered and customer funds showed growth.
- Net interest income impacted by the interest rate environment.
- NPL ratio improvement during the quarter.
- Year-on-year comparison influenced at the net attributable profit level by the increase in the impairment of financial assets line in March 2020 due to the outbreak of the pandemic.
Results
Net interest income
1,366Gross income
1,761Operating income
1,138Net attributable profit
493Activity (2)
Performing loans and advances to customers under mangement
+1.5%
Customers funds under management
+3.7%
Risks
NPL coverage ratio
NPL ratio
Cost of risk
(2) Excluding repos.
(1) Year on year changes at constant exchange rate.
Turkey
€834 Mill.*
+2.8%
Year on year changes. Balances as of 31-03-21.
Highlights
- Activity growth driven by Turkish lira loans and deposits.
- Outstanding performance of NTI and net fees.
- Operating expenses growth in line with the average inflation.
- Net attributable profit growth driven by lower impairment losses on financial assets in a comparative affected by the outbreak of the pandemic.
Results
Net interest income
530Gross income
834Operating income
569Net attributable profit
191Activity (1)
Performing loans and advances to customers under mangement
+5.2%
Customers funds under management
+4.2%
Risks
NPL coverage ratio
NPL ratio
Cost of risk
(1) Excluding repos.
(2) Year on year changes at constant exchange rate.
South America
€714 Mill.*
+2.6%
Year on year changes. Balances as of 31-03-21.
Highlights
- Lending activity influenced by the completion of the Plan Reactiva in Peru and lockdowns in the first quarter of 2021.
- Reduction in higher-cost resources.
- Favorable year-on-year evolution of recurrent income and NTI.
- Net attributable profit year-on-year comparison influenced by the increase in the impairment on financial assets line in March 2020 due to the outbreak of the pandemic.
Results
Net interest income
660Gross income
714Operating income
377Net attributable profit
104Activity (1)
Performing loans and advances to customers under mangement
+0.9%
Customers funds under management
+0.5%
Risks
NPL coverage ratio
NPL ratio
Cost of risk
(1) Excluding repos.
(2) Year on year changes at constant exchange rates.
Excludes BBVA Paraguay.
Rest of business
€218 Mill.*
+7.0%
Year on year changes. Balances as of 31-03-21.
Highlights
- Slight increase in lending and a decrease in customers funds in the quarter.
- NPL ratio contained.
- Net interest income growth and good performance of NTI.
- Reduction of operating expenses.
Results
Net interest income
72Gross income
218Operating income
103Net attributable profit
75Activity (1)
Performing loans and advances to customers under mangement
+0.7%
Customers funds under management
-27.8%
Risks
NPL coverage ratio
NPL ratio
Cost of risk
(1) Excluding repos.
(2) Year on year changes.
* Gross income
(1) Excludes BBVA Paraguay.
This section presents and analyzes the most relevant aspects of the Group's different business areas. Specifically, for each one of them, it shows a summary of the income statement and balance sheet, the business activity figures and the most significant ratios.
BBVA Group’s business areas reporting structure differs from the one presented at the end of 2020, mainly as a consequence of the disappearance of the United States as a business area, derived from the sale agreement reached with PNC. Most of the businesses in the United States excluded from this agreement, together with those of the former business area “Rest of Eurasia” constitute a new area called “Rest of Business”.
The composition of BBVA Group business areas at the end of the first quarter of 2021 are summarized below:
- Spain mainly includes the banking and insurance businesses that the Group carries out in this country, including the results of the new company created from the bancassurance agreement reached with Allianz at the end of 2020.
- Mexico includes banking and insurance businesses in this country, as well as the activity that BBVA Mexico carries out through its branch in Houston.
- Turkey reports the activity of the group Garanti BBVA that is mainly carried out in this country and, to a lesser extent, in Romania and the Netherlands.
- South America mainly includes banking and insurance activity conducted in the region. The information for this business area includes BBVA Paraguay data for the results, activity, balances and relevant business indicators for 2020 and is not included in 2021 as the sale agreement was reached in January 2021.
- Rest of Business mainly incorporates the wholesale activity carried out in Europe (excluding Spain) and in the United States from the New York branch, as well as, the institutional business that the Group develops through the broker dealer BBVA Securities Inc. It also incorporates the banking business developed through BBVA’s 5 branches in Asia.
The Corporate Center contains the centralized functions of the Group, including: the costs of the head offices with a corporate function; management of structural exchange rate positions, portfolios whose management is not linked to customer relationships, such as industrial holdings; certain tax assets and liabilities; funds due to commitments to employees; goodwill and other intangible assets as well as such portfolios and assets´ funding. Furthermore, includes the results from the venture capital fund Propel Venture Partners. Additionally and until all required authorizations are received and the aforementioned sale agreement with PNC is realized, the results obtained by the Group´s businesses in The United States included in said agreement are presented in a single line of the income statements called “Profit (loss) after taxes from discontinued operations”.
In addition to these geographical breakdowns, supplementary information is provided for the wholesale business carried out by BBVA, Corporate & Investment Banking (CIB), in the countries where it operates. This business is relevant to have a broader understanding of the Group's activity and results due to the important features of the type of customers served, products offered and risks assumed.
The information by business area is based on units at the lowest level and/or companies that comprise the Group, which are assigned to the different areas according to the main region or company group in which they carry out their activity. The figures corresponding to 2020 have been elaborated following the same criteria and the same structure of the areas that have been already explained, in a way that year-on-year comparisons are homogeneous.
Regarding the Shareholders´ funds allocation, a capital allocation system based on the consumed regulatory capital is used.
As usual, in the case of the different business areas in South America, in Turkey, in Rest of Business and in CIB, the results applying constant exchange rates are given as well as the year-on-year variations at current exchange rates.
Main income statement line items by business area (Millions of euros)
| Business areas | |||||||||
|---|---|---|---|---|---|---|---|---|---|
| BBVA Group |
Spain | Mexico | Turkey | South America |
Rest of Business |
∑ Business areas | Corporate Center | ||
| 31-03-21 | |||||||||
| Net interest income | 3,451 | 867 | 1,366 | 530 | 660 | 72 | 3,495 | (44) | |
| Gross income | 5,155 | 1,646 | 1,761 | 834 | 714 | 218 | 5,173 | (18) | |
| Operating income | 2,850 | 893 | 1,138 | 569 | 377 | 103 | 3,081 | (230) | |
| Profit/(loss) before tax | 1,759 | 522 | 682 | 481 | 202 | 93 | 1,980 | (221) | |
| Profit/(loss) after tax from discontinued operations (1) | 177 | - | - | - | - | - | - | 177 | |
| Net attributable profit/(loss) | 1,210 | 381 | 493 | 191 | 104 | 75 | 1,244 | (34) | |
| 31-03-20 | |||||||||
| Net interest income | 4,024 | 878 | 1,545 | 819 | 763 | 65 | 4,071 | (47) | |
| Gross income | 5,778 | 1,511 | 1,993 | 1,073 | 863 | 211 | 5,650 | 127 | |
| Operating income | 3,300 | 731 | 1,331 | 763 | 473 | 86 | 3,384 | (83) | |
| Profit/(loss) before tax | 807 | (194) | 545 | 340 | 136 | 88 | 915 | (108) | |
| Profit/(loss) after tax from discontinued operations (1) | (2,224) | - | - | - | - | - | - | (2,224) | |
| Net attributable profit/(loss) | (1,792) | (130) | 373 | 129 | 70 | 68 | 509 | (2,301) | |
- (1) Including the results generated by BBVA USA and the rest of the Group's companies in the United States included in the sale agreement signed with PNC.
GROSS INCOME(1), OPERATING INCOME(1) AND NET ATTRIBUTABLE PROFIT(1) BREAKDOWN (PERCENTAGE. 1Q21)

(1) Excludes the Corporate Center.
MAIN BALANCE-SHEET ITEMS AND RISK-WEIGHTED ASSETS BY BUSINESS AREA (MILLIONS OF EUROS)
| Business areas | ||||||||||
|---|---|---|---|---|---|---|---|---|---|---|
| BBVA Group |
Spain | Mexico | Turkey | South America |
Rest of business |
∑ Business areas | Corporate Center | Deletions | AyPNCV (1) | |
| 31-03-21 | ||||||||||
| Loans and advances to customers |
310,683 | 166,093 | 51,525 | 36,859 | 32,443 | 24,450 | 311,369 | 669 | (1,355) | - |
| Deposits from customers | 331,064 | 196,590 | 56,832 | 38,089 | 34,920 | 6,764 | 333,196 | 177 | (2,309) | - |
| Off-balance sheet funds | 106,916 | 64,452 | 23,834 | 3,667 | 14,433 | 530 | 106,915 | 0 | - | - |
| Total assets/ liabilities and equity | 719,705 | 394,904 | 110,412 | 58,876 | 53,164 | 36,015 | 653,371 | 109,353 | (43,019) | - |
| APRs | 354,342 | 107,872 | 61,981 | 53,252 | 38,948 | 28,436 | 290,489 | 63,853 | - | - |
| 31-12-20 | ||||||||||
| Loans and advances to customers |
311,147 | 167,998 | 50,002 | 37,295 | 33,615 | 24,015 | 312,926 | 505 | (1,299) | (985) |
| Deposits from customers | 342,661 | 206,428 | 54,052 | 39,353 | 36,874 | 9,333 | 346,040 | 363 | (2,449) | (1,293) |
| Off-balance sheet funds | 102,947 | 62,707 | 22,524 | 3,425 | 13,722 | 569 | 102,947 | - | - | - |
| Total assets/ liabilities and equity | 736,176 | 410,409 | 110,236 | 59,585 | 55,436 | 35,172 | 670,839 | 105,416 | (40,080) | - |
| APRs | 353,273 | 104,388 | 60,825 | 53,021 | 39,804 | 24,331 | 282,370 | 70,903 | - | - |
- (1) Non-current assets and liabilities held for sale (NCA&L) from BBVA Paraguay as of 31-12-20.
The balance sheet includes a column, which represents the deletions and balance sheet adjustments between the different business areas, especially in terms of the relationship between the areas in which the parent company operates, i.e. Spain, Rest of Business, and the Corporate Center.
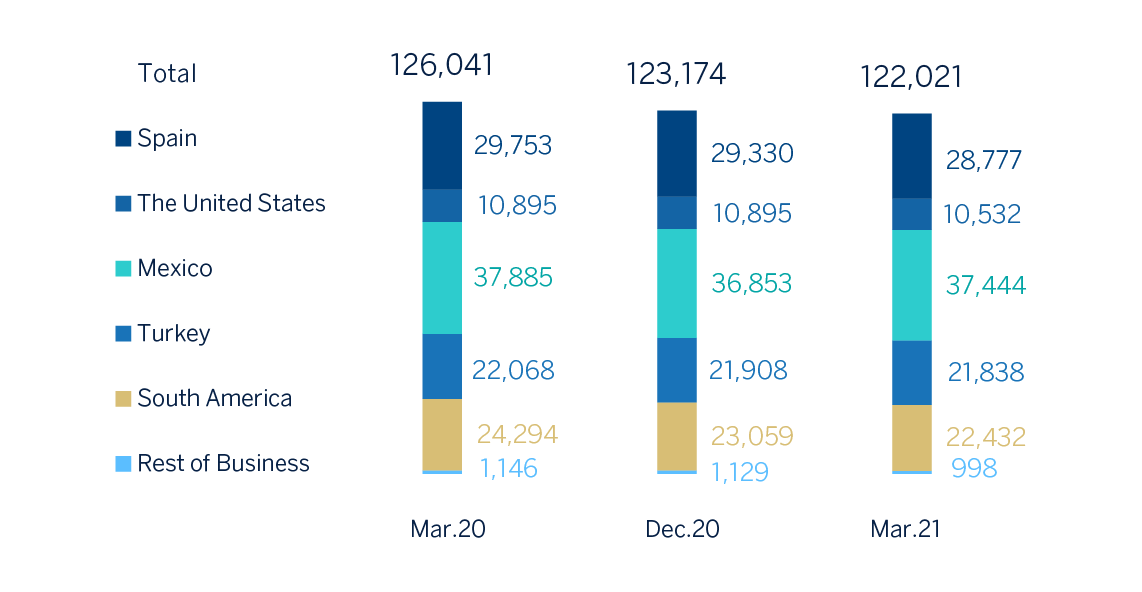
Number of employees

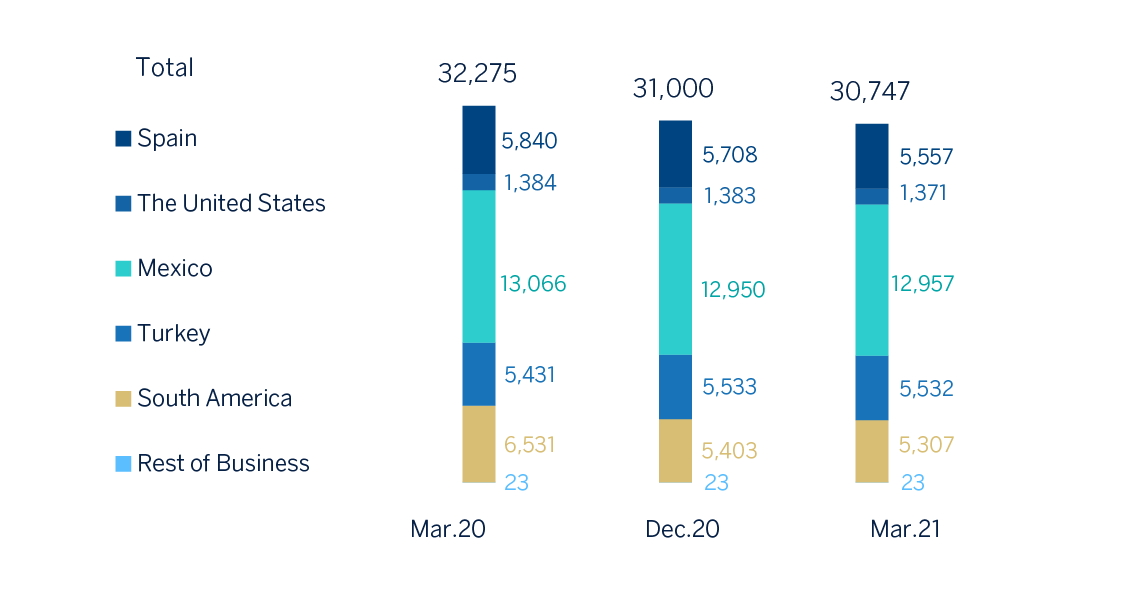
Number of branches

Number of ATMs

