
South America
Highlights
- Lending activity influenced by the completion of the Plan Reactiva in Peru and lockdowns in the first quarter of 2021.
- Reduction in higher-cost resources.
- Favorable year-on-year evolution of recurrent income and NTI.
- Net attributable profit year-on-year comparison influenced by the increase in the impairment on financial assets line in March 2020 due to the outbreak of the pandemic.
Business activity (1)
(YEAR-TO-DATE CHANGE)

(1) Excluding repos.
It excludes the balances of BBVA Paraguay
as of 31-12-2020.
Net interest income/ATAs
(Percentage. Constant exchange rates)
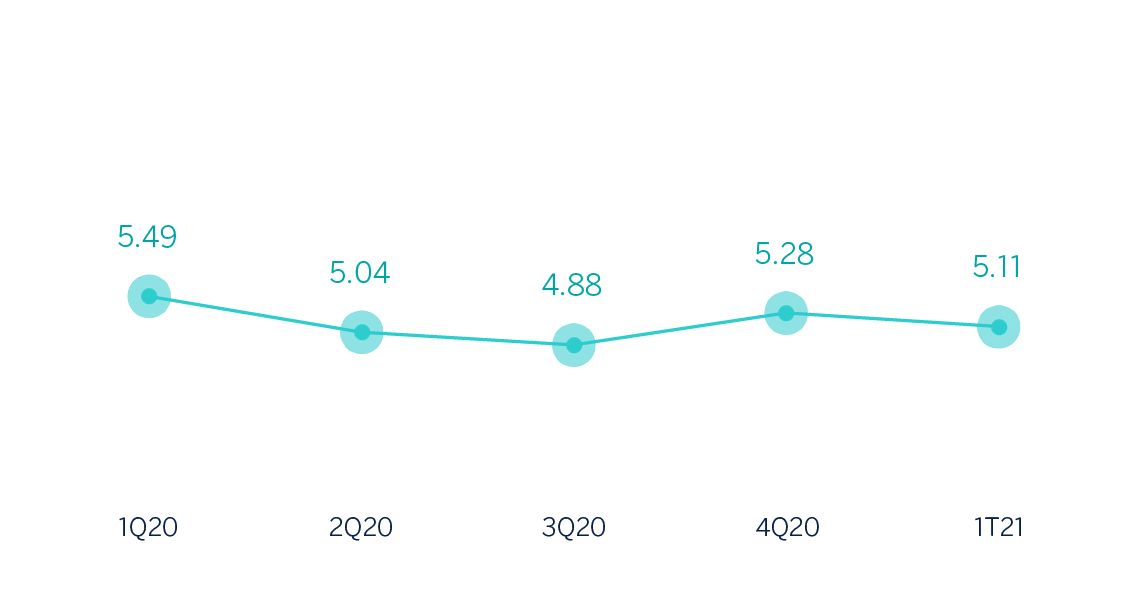
General note: Excluding BBVA Paraguay.
Operating income
(Millions of euros at constant exchange rates)

(1) At current exchange rate: -20.3%.
At constant exchange rate, excluding BBVA
Paraguay in 1Q20: +3.4%.
Net attributable profit
(Millions of euros at constant exchange rates)
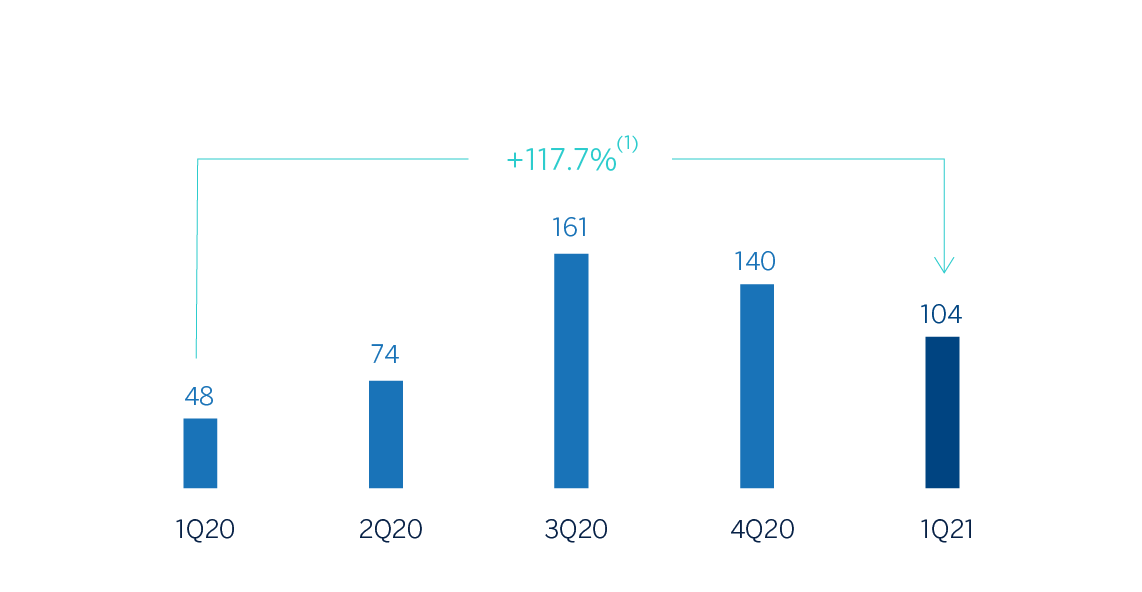
(1) At current exchange rate: +48.6%
At constant exchange rate, excluding BBVA
Paraguay in 1Q20: +150.2%.
Financial statements and relevant business indicators (Millions of euros and percentage)
| Income statement | 1Q21 | ∆% | ∆% (1) | ∆% (2) | 1Q20 |
|---|---|---|---|---|---|
| Net interest income | 660 | (13.5) | 5.7 | 8.2 | 763 |
| Net fees and commissions | 120 | 0.8 | 21.9 | 25.0 | 119 |
| Net trading income | 74 | (7.4) | 15.3 | 18.0 | 80 |
| Other operating income and expenses | (140) | 39.8 | 53.0 | 55.5 | (100) |
| Gross income | 714 | (17.2) | 2.6 | 5.2 | 863 |
| Operating expenses | (337) | (13.5) | 5.0 | 7.2 | (390) |
| Personnel expenses | (166) | (15.9) | 3.6 | 6.1 | (197) |
| Other administrative expenses | (137) | (7.7) | 11.3 | 13.3 | (148) |
| Depreciation | (34) | (21.8) | (9.7) | (7.8) | (44) |
| Operating income | 377 | (20.3) | 0.6 | 3.4 | 473 |
| Impaiment on financial assets not measured at fair value through profit or loss | (159) | (50.0) | (41.0) | (40.2) | (319) |
| Provisions or reversal of provisions and other results | (16) | (9.7) | 20.6 | 22.8 | (18) |
| Profit/(loss) before tax | 202 | 47.9 | 119.6 | 137.3 | 136 |
| Income tax | (59) | 101.1 | 212.2 | 223.7 | (29) |
| Profit/(loss) for the year | 143 | 33.3 | 95.6 | 113.7 | 107 |
| Non-controlling interests | (39) | 4.8 | 54.1 | 54.1 | (37) |
| Net attributable profit | 104 | 48.6 | 117.7 | 150.2 | 70 |
| Balance sheets | 31-03-21 | ∆% | ∆% (1) | ∆% (2) | 31-12-20 |
|---|---|---|---|---|---|
| Cash, cash balances at central banks and other demand deposits | 6,795 | (4.7) | (4.5) | 3.0 | 7,127 |
| Financial assets designated at fair value | 7,433 | 1.4 | 3.3 | 3.3 | 7,329 |
| Of which loans and advances | 656 | n.s. | n.s. | n.s. | 108 |
| Financial assets at amortized cost | 36,381 | (5.6) | (5.0) | (1.8) | 38,549 |
| Of which loans and advances to customers | 32,443 | (3.5) | (2.8) | 0.7 | 33,615 |
| Tangible assets | 806 | (0.3) | 0.3 | 1.4 | 808 |
| Other assets | 1,750 | 7.8 | 9.3 | 11.5 | 1,624 |
| Total assets/liabilities and equity | 53,164 | (4.1) | (3.4) | (0.1) | 55,436 |
| Financial liabilities held for trading and designated at fair value through profit or loss | 1,223 | (7.8) | (4.9) | (4.8) | 1,326 |
| Deposits from central banks and credit institutions | 5,197 | (3.4) | (3.7) | (3.5) | 5,378 |
| Deposits from customers | 34,920 | (5.3) | (4.5) | (0.3) | 36,874 |
| Debt certificates | 3,234 | (1.1) | (0.9) | (0.0) | 3,269 |
| Other liabilities | 4,045 | 6.1 | 7.6 | 9.3 | 3,813 |
| Economic capital allocated | 4,547 | (4.8) | (4.0) | (0.3) | 4,776 |
| Relevant business indicators | 31-03-21 | ∆% | ∆% (1) | ∆% (2) | 31-12-20 |
|---|---|---|---|---|---|
| Performing loans and advances to customers under management (3) | 32,587 | (3.4) | (2.6) | 0.9 | 33,719 |
| Non-performing loans | 1,792 | 0.6 | 1.4 | 3.9 | 1,780 |
| Customer deposits under management (4) | 34,932 | (5.3) | (4.5) | (0.3) | 36,886 |
| Off-balance sheet funds (5) | 14,433 | 5.2 | 2.7 | 2.7 | 13,722 |
| Risk-weighted assets | 38,948 | (2.2) | (1.2) | 2.4 | 39,804 |
| Efficiency ratio (%) | 47.2 | 42.6 | |||
| NPL ratio (%) | 4.6 | 4.4 | |||
| NPL coverage ratio (%) | 109 | 110 | |||
| Cost of risk (%) | 1.81 | 2.36 |
- (1) Figures at constant exchange rates.
- (2) Figures at constant exchange rates excluding BBVA Paraguay.
- (3) Excluding repos.
- (4) Excluding repos and including specific marketable debt securities.
- (5) Includes mutual funds, pension funds and other off-balance sheet funds.
South America. Data per country (Millions of euros)
| Operating income | Net attributable profit/(loss) | |||||||
|---|---|---|---|---|---|---|---|---|
| Country | 1Q 2021 | ∆% | ∆% (1) | 1Q 2020 | 1Q 2021 | ∆% | ∆% (1) | 1Q 2020 |
| Argentina | 33 | (64.1) | n.s. | 92 | 6 | (29.0) | n.s. | 8 |
| Colombia | 145 | 3.4 | 13.6 | 140 | 48 | n.s. | n.s. | 8 |
| Peru | 162 | (11.9) | 3.5 | 183 | 28 | (6.0) | 10.5 | 30 |
| Other countries (2) | 38 | (34.5) | (29.6) | 58 | 22 | (8.8) | 2.5 | 24 |
| Total | 377 | (20.3) | 0.6 | 473 | 104 | 48.6 | 117.7 | 70 |
- (1) Figures at constant exchange rates.
- (2) Bolivia, Chile (Forum), Paraguay in 2020, Uruguay and Venezuela. Additionally, it includes eliminations and other charges.
South America. Relevant business indicators per country (Millions of euros)
| Argentina | Colombia | Peru | ||||
|---|---|---|---|---|---|---|
| 31-03-21 | 31-12-20 | 31-03-21 | 31-12-20 | 31-03-21 | 31-12-20 | |
| Performing loans and advances to customers under management (1) (2) | 2,744 | 2,693 | 11,365 | 11,230 | 15,293 | 15,227 |
| Non-performing loans and guarantees given (1) | 66 | 50 | 670 | 651 | 953 | 911 |
| Customer deposits under management (1) (3) | 4,706 | 4,426 | 11,750 | 11,660 | 15,192 | 15,976 |
| Off-balance sheet funds (1) (4) | 1,327 | 928 | 1,131 | 1,506 | 2,326 | 2,163 |
| Risk-weighted assets | 5,727 | 5,685 | 12,609 | 13,096 | 16,676 | 15,845 |
| Efficiency ratio (%) | 76.0 | 53.6 | 35.8 | 35.2 | 38.4 | 37.7 |
| NPL ratio (%) | 2.3 | 1.8 | 5.2 | 5.2 | 4.8 | 4.5 |
| NPL coverage ratio (%) | 202 | 241 | 112 | 113 | 101 | 101 |
| Cost of risk (%) | 2.23 | 3.24 | 2.29 | 2.64 | 1.68 | 2.13 |
- (1) Figures at constant exchange rates.
- (2) Excluding repos.
- (3) Excluding repos and including specific marketable debt securities.
- (4) Includes mutual funds.
Unless expressly stated otherwise, all the comments below on rates of change, for both activity and results, will be given at constant exchange rates. These rates, together with the changes at current exchange rates, can be found in the attached tables of the financial statements and relevant business indicators. The information for this business area includes BBVA Paraguay with regard to data on the results, activity, balance sheet and relevant business indicators for 2020, but does not include Paraguay for 2021, as the sale agreement materialized in January of that year. To facilitate an homogeneous comparison, the attached tables include a column at constant exchange rates that does not take BBVA Paraguay into account. All comments for this area also exclude BBVA Paraguay.
Activity and results
The most relevant aspects related to the area's activity during the first quarter of 2021 were:
- Lending activity (performing loans under management) showed an increase of 0.9% compared to December 2020, despite the outbreaks of COVID-19, which have resulted in lockdowns and mobility restrictions in some countries in the area; this comparison was also influenced by the summer seasonality. By portfolio, the wholesale portfolio recorded an increase of 0.6% and the retail portfolio closed with a growth of 1.2% compared to 2020.
- In terms of asset quality, the non-performing loan ratio stood at 4.6%, presenting an increase compared to December 2020, while the NPL coverage ratio decreased to 109% in the same period.
- Customer funds remained stable (up 0.5%) compared to the closing balance at the end of December 2020. Deposits from customers under management fell 0.3%. Off-balance sheet funds grew 2.7% between January and March 2021, with customer balances shifting from higher-cost transactional products toward off-balance sheet funds in search for increased profitability.
South America generated a cumulative net attributable profit of €104m between January and March 2021, representing a year-on-year increase of 150.2%, mainly due to the significant provision for impairment on financial assets in March 2020, as a result of the worsening macroeconomic scenario following the pandemic outbreak. The cumulative impact of inflation in Argentina on the area's net attributable profit in March 2021 stood at a loss of €-43m, compared to a cumulative loss of €-34m at the close of March 2020.
The evolution throughout the first three months of 2021 for the business area's most representative countries, Argentina, Colombia and Peru, is summarized below:
Argentina
- Lending activity grew 1.9% from the end of December 2020, in spite of restrictions on mobility due to COVID19 and on the holiday seasonality in January and February, especially in the business segment. In retail portfolios, growth in consumer finance was notable as a result of the promotion plans implemented. The NPL ratio stood at 2.3% and the NPL coverage ratio at 202% as of March 31, 2021.
- Balance sheet funds continued to grow, albeit at more moderate rates than those recorded in 2020, while offbalance sheet funds increased by 43.0% year-to-date.
- Net attributable profit stood at €6m, with recurrent income performing well, a greater contribution in NTI (net trading income) due to foreign exchange trading operations, as well as reduced impairment on financial assets, in a year-on-year comparison influenced by significant provisions in this regard following the outbreak of the pandemic in the first quarter of 2020, in addition to a higher inflation rate.
Colombia
- Lending activity grew by 4.0% in 2020 due to the performance of retail portfolios (up 5.1% year-on-year), particularly consumer and mortgages, the latter supported by government incentives for non-social housing. In terms of asset quality, the NPL ratio and NPL coverage ratio improved to 5.2% and 113% respectively at the close of December 2020.
- Deposits from customers under management increased by 9.3% in 2020, driven by growth in demand deposits. Off-balance sheet funds continued their recovery after the withdrawals seen at the end of the first quarter of the year and closed 29.0% higher than the one reached at the end of December 2019. In the quarter, the search for more profitable investment alternatives by customers, in line with the bank's strategy of reducing financial costs, meant a reduction in deposits from customers (down 0.9%).
- Net attributable profit stood at €165m, with a year-on-year decrease of 28.9%. The strength of operating income is notable, which increased by 6.2% in 2020 thanks to higher income generation from net interest income and NTI, although there was a negative impact from the higher loan-loss provisioning due to the COVID-19 crisis.
Peru
- Lending activity closed the quarter in line with the end of 2020 (up 0.4%), mainly due to the performance of mortgages and consumer finance. It is worth noting that corporate balances, despite the Plan Reactiva being completed in December 2020, remained stable in March (down 0.1%). In terms of asset quality, the NPL ratio stood at 4.8% as of March 31, 2021, while the NPL coverage ratio stood at 101%.
- Deposits from customers under management fell 4.9% in the first three months of 2021, with a decrease in demand and term deposits. Off-balance sheet funds grew 7.5%.
- Net interest income decreased between January and March 2021 compared to the same period last year, due to pressure on interest rates. Fees performed very well and grew 21.2%, due to activity with companies. Operating expenses remained under control, with a year-on-year decrease of 1.1%, which, together with the increase in gross income, represent a slight improvement in the efficiency ratio to 38.4%, at constant exchange rates. There was a year-on-year reduction in provisions for impairment on financial assets as a result of significant provisions made in March 2020 following the pandemic outbreak. As a result, net attributable profit stood at €28m, 10.5% higher than in the first quarter of 2020.