
Spain
Highlights
- Decrease in lending activity and customers funds.
- Improved efficiency ratio.
- Favorable year-on-year evolution for the main margins.
- Sustainable alternative for all products.
Business activity (1)
(YEAR-TO-DATE CHANGE)
(1) Excluding repos.
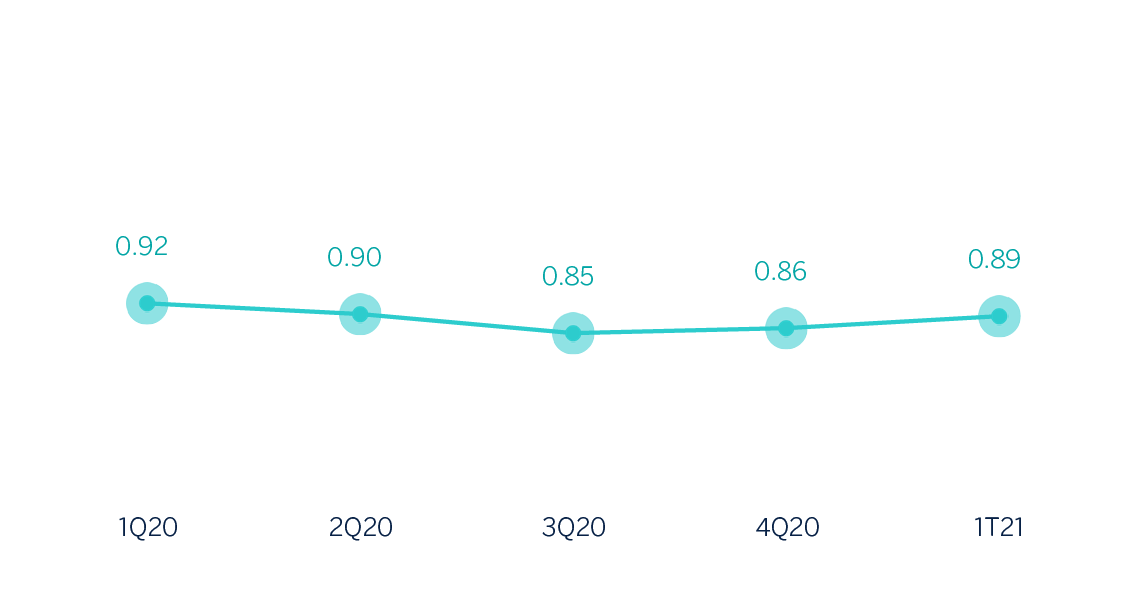
Net interest income/ATAs
(Percentage)
Operating income (Millions of euros)

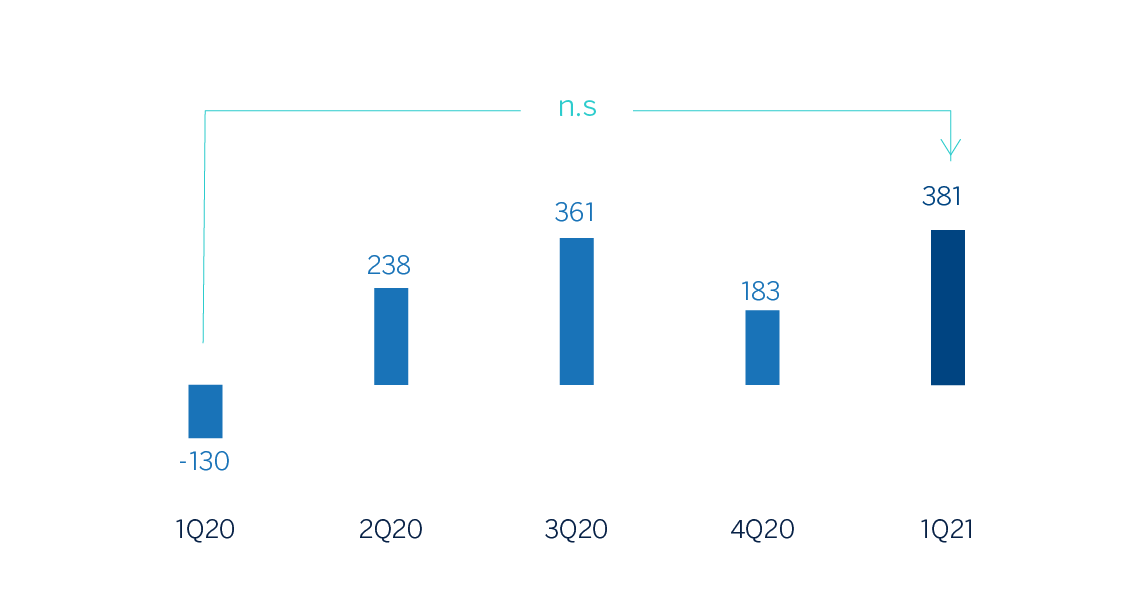
Net attributable profit (Millions of euros)
Financial statements and relevant business indicators (Millions of euros and percentage)
| Income statement | 1Q21 | ∆% | 1Q20 |
|---|---|---|---|
| Net interest income | 867 | (1.3) | 878 |
| Net fees and commissions | 507 | 8.1 | 469 |
| Net trading income | 201 | 231.9 | 61 |
| Other operating income and expenses | 71 | (31.6) | 103 |
| Of which insurance activities (1) | 90 | (24.8) | 119 |
| Gross income | 1,646 | 8.9 | 1,511 |
| Operating expenses | (753) | (3.5) | (780) |
| Personnel expenses | (428) | (2.8) | (440) |
| Other administrative expenses | (215) | (4.4) | (225) |
| Depreciation | (110) | (4.3) | (115) |
| Operating income | 893 | 22.2 | 731 |
| Impairment on financial assets not measured at fair value through profit or loss | (185) | (72.0) | (660) |
| Provisions or reversal of provisions and other results | (186) | (30.0) | (265) |
| Profit/(loss) before tax | 522 | n.s. | (194) |
| Income tax | (140) | n.s. | 65 |
| Profit/(loss) for the year | 382 | n.s. | (129) |
| Non-controlling interests | (1) | (41.9) | (1) |
| Net attributable profit | 381 | n.s. | (130) |
- (1) Includes premiums received net of estimated technical insurance reserves.
| Balance sheets | 31-03-21 | ∆% | 31-03-20 |
|---|---|---|---|
| Cash, cash balances at central banks and other demand deposits | 26,118 | (31.9) | 38,356 |
| Financial assets designated at fair value | 135,929 | (1.5) | 137,969 |
| Of which: Loans and advances | 33,003 | 7.6 | 30,680 |
| Financial assets at amortized cost | 195,621 | (1.3) | 198,173 |
| Of which: Loans and advances to customers | 166,093 | (1.1) | 167,998 |
| Inter-area positions | 28,485 | 7.6 | 26,475 |
| Tangible assets | 2,825 | (2.6) | 2,902 |
| Other assets | 5,926 | (9.3) | 6,535 |
| Total assets/liabilities and equity | 394,904 | (3.8) | 410,409 |
| Financial liabilities held for trading and designated at fair value through profit or loss | 70,950 | (4.0) | 73,921 |
| Deposits from central banks and credit institutions | 59,595 | 1.4 | 58,783 |
| Deposits from customers | 196,590 | (4.8) | 206,428 |
| Debt certificates | 37,856 | (7.7) | 41,016 |
| Inter-area positions | - | - | - |
| Other liabilities | 17,254 | 1.8 | 16,955 |
| Economic capital allocated | 12,660 | (4.9) | 13,306 |
| Relevant business indicators | 31-03-21 | ∆% | 31-03-20 |
|---|---|---|---|
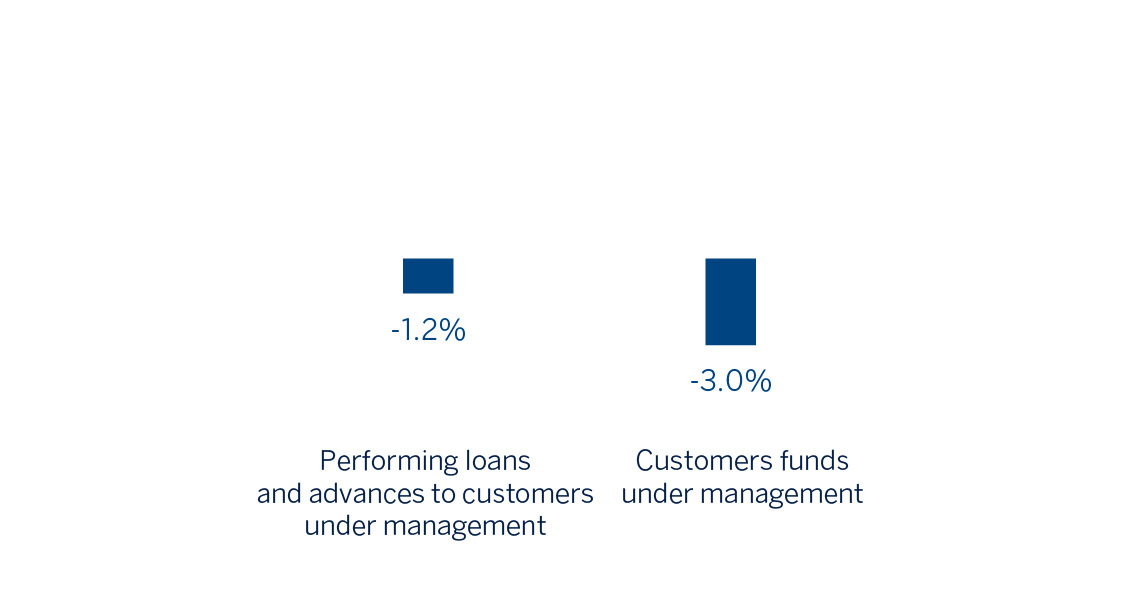
| Performing loans and advances to customers under management (1) | 163,501 | (1.2) | 165,511 |
| Non-performing loans | 8,495 | 1.9 | 8,340 |
| Customer deposits under management (1) | 196,005 | (4.8) | 205,809 |
| Off-balance sheet funds (2) | 64,452 | 2.8 | 62,707 |
| Risk-weighted assets | 107,872 | 3.3 | 104,388 |
| Efficiency ratio (%) | 45.7 | 54.6 | |
| NPL ratio (%) | 4.4 | 4.3 | |
| NPL coverage ratio (%) | 66 | 67 | |
| Cost of risk (%) | 0.45 | 0.67 |
- (1) Excluding repos.
- (2) Includes mutual funds and pension funds.
Activity
The most relevant aspects related to the area's activity during the first quarter of 2021 were:
- Lending activity (performing loans under management) was below the figure recorded at the end of 2020 (down 1.2%), mainly due to a reduction in mortgage loans (down 0.5%) and lower short-term operations among larger companies (down 2.3%). The above is despite higher balances in retail businesses (up 0.1%), SMEs (up 0.9%) and consumer finance together with credit cards (up 0.3%).
- With regard to asset quality, the NPL ratio therefore rose 11 basis points in the quarter to stand at 4.4%, and the NPL coverage ratio fell 39 basis points to 66% in the first three months of 2021.
- Total customer funds fell 3.0% compared to 2020 year-end, due to the lower total balance of customer deposits under management (down 4.8%). Off-balance sheet funds performed positively (up 2.8%).
Results
Spain generated a net attributable profit of €381m between January and March 2021, which compares very positively to the loss of €130m recorded in the same period in 2020, mainly due to the increase in impairment on financial assets resulting from the worsening macroeconomic scenario following the outbreak of the pandemic in March 2020.The main highlights of the area's income statement are:
- Net interest income recorded a year-on-year reduction of 1.3%, affected by an environment of falling rates and partially offset by lower financing costs.
- Net fees and commissions performed well (up 8.1% year-on-year), underpinned by higher volumes in off-balance sheet funds, with a higher contribution from revenues associated with banking services and insurance.
- NTI between January and March 2021 stood at €201m, which compares very positively to the €61m recorded in the same period last year, mainly due to the performance of the Global Markets area but also as a result of fixed-income portfolio sales.
- The other operating income and expenses line compares negatively with the first quarter of the previous year (down 31.6%), mainly due to the lower contribution from the insurance business following the bancassurance operation with Allianz.
- Reduction of operating expenses (down 3.5% in year-on-year terms) as a result of lower personnel and general expenses and depreciations. The efficiency ratio therefore stood at 45.7% compared to 54.6% in the same quarter in 2020.
- Impairment on financial assets amounted to €-185m, which represents a significant reduction from the amount recorded in the first quarter of 2020, which was negatively impacted by the deterioration of the macroeconomic scenario due to COVID-19, following the outbreak of the pandemic. The cumulative cost of risk at the close of March 2021 stood at 0.45%.
- Lastly, the provisions and other results line closed the quarter at €-186m, compared to €-265m in the same period last year, which included provisions for potential claims.