
Mexico
Highlights
- Activity increased in the quarter: lending activity recovered and customer funds showed growth.
- Net interest income impacted by the interest rate environment.
- NPL ratio improvement during the quarter.
- Year-on-year comparison influenced at the net attributable profit level by the increase in the impairment of financial assets line in March 2020 due to the outbreak of the pandemic.
Business activity (1)
(YEAR-TO-DATE CHANGE)
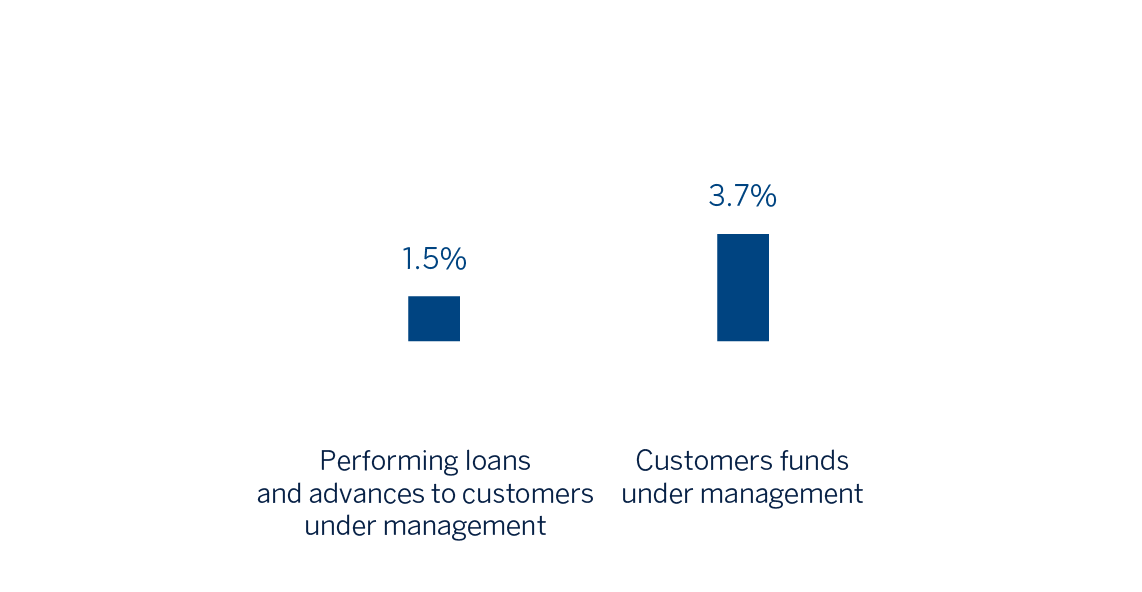
(1) Excluding repos.
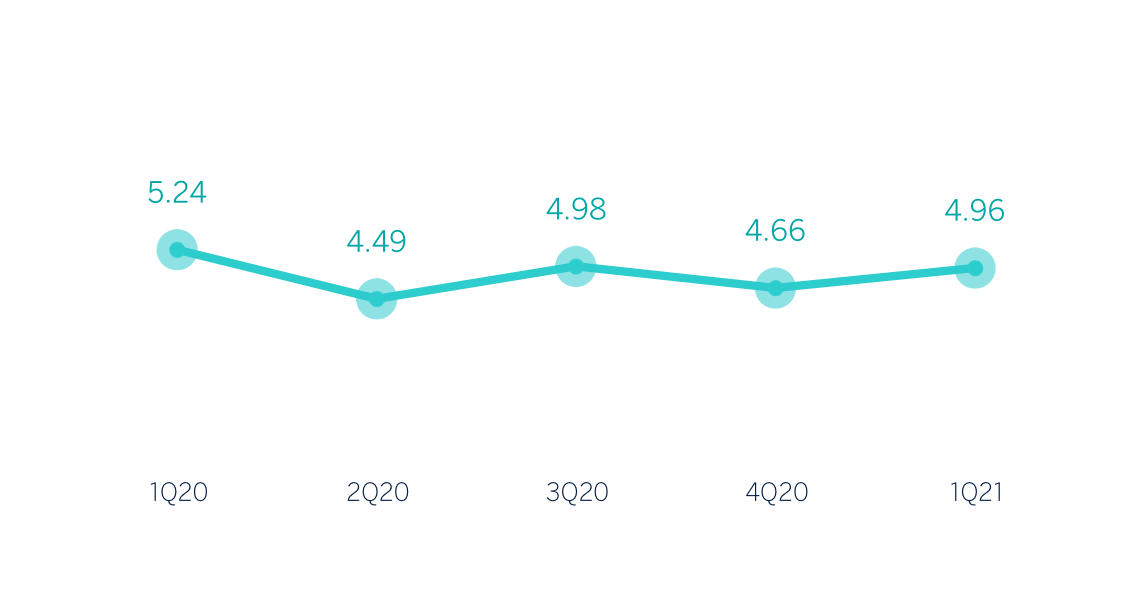
Net interest income/ATAs
(Percentage. Constant exchange rate)
Operating income
(Millions of euros at constant exchange rate)
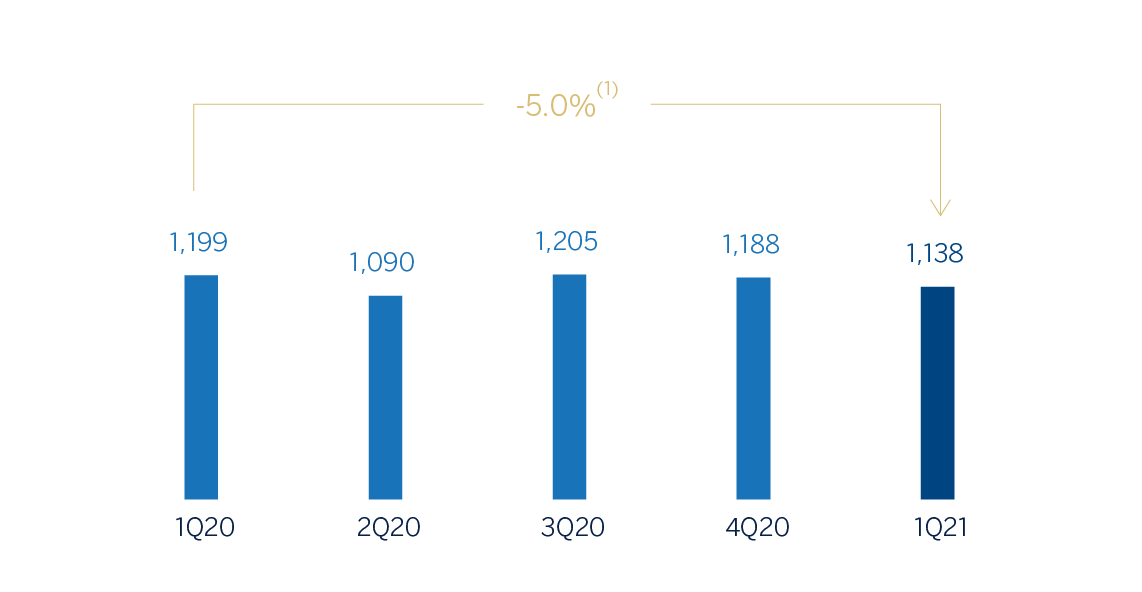
(1) At current exchange rate: -14.4%.
Net attributable profit
(Millions of euros at constant exchange rate)
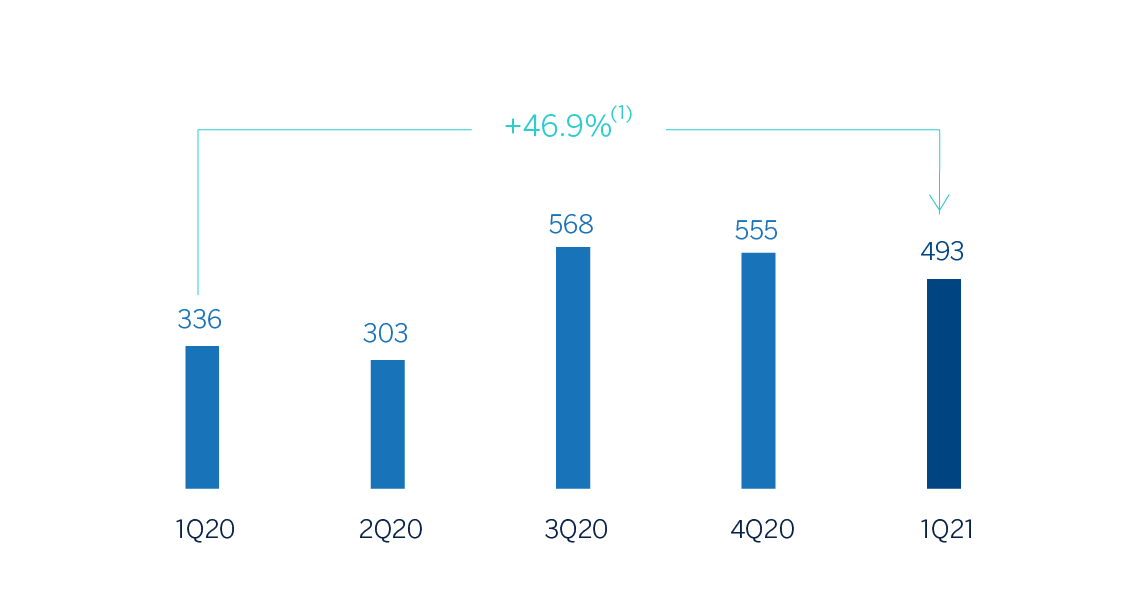
(1) At current exchange rate: +32.3%.
Financial statements and relevant business indicators (Millions of euros and percentage)
| Income statement | 1Q 2021 | ∆% | ∆% (1) | 1Q 2020 |
|---|---|---|---|---|
| Net interest income | 1,366 | (11.6) | (1.8) | 1,545 |
| Net fees and commissions | 282 | (4.7) | 5.8 | 296 |
| Net trading income | 69 | (11.7) | (1.9) | 78 |
| Other operating income and expenses | 44 | (40.8) | (34.2) | 74 |
| Gross income | 1,761 | (11.7) | (1.9) | 1,993 |
| Operating expenses | (622) | (6.1) | 4.3 | (662) |
| Personnel expenses | (255) | (11.4) | (1.6) | (288) |
| Other administrative expenses | (289) | (0.1) | 11.0 | (289) |
| Depreciation | (78) | (8.4) | 1.7 | (86) |
| Operating income | 1,138 | (14.4) | (5.0) | 1,331 |
| Impairment on financial assets not measured at fair value through profit or loss | (458) | (40.8) | (34.2) | (773) |
| Provisions or reversal of provisions and other results | 2 | n.s. | n.s. | (13) |
| Profit/(loss) before tax | 682 | 25.2 | 39.0 | 545 |
| Income tax | (189) | 9.9 | 22.0 | (172) |
| Profit/(loss) for the year | 493 | 32.3 | 46.9 | 373 |
| Non-controlling interests | (0) | 25.0 | 38.8 | (0) |
| Net attributable profit | 493 | 32.3 | 46.9 | 373 |
| Balance sheets | 31-03-21 | ∆% | ∆% (1) | 31-12-20 |
|---|---|---|---|---|
| Cash, cash balances at central banks and other demand deposits | 10,641 | 16.2 | 14.4 | 9,161 |
| Financial assets designated at fair value | 33,915 | (6.7) | (8.1) | 36,360 |
| Of which loans and advances | 1,312 | (49.3) | (50.1) | 2,589 |
| Financial assets at amortized cost | 60,858 | 1.7 | 0.2 | 59,819 |
| Of which loans and advances to customers | 51,525 | 3.0 | 1.5 | 50,002 |
| Tangible assets | 1,644 | (0.2) | (1.7) | 1,647 |
| Other assets | 3,354 | 3.2 | 1.7 | 3,249 |
| Total assets/liabilities and equity | 110,412 | 0.2 | (1.3) | 110,236 |
| Financial liabilities held for trading and designated at fair value through profit or loss | 21,138 | (11.2) | (12.5) | 23,801 |
| Deposits from central banks and credit institutions | 5,023 | (2.0) | (3.5) | 5,125 |
| Deposits from customers | 56,832 | 5.1 | 3.6 | 54,052 |
| Debt certificates | 7,575 | (0.8) | (2.3) | 7,640 |
| Other liabilities | 12,743 | (1.3) | (2.8) | 12,911 |
| Economic capital allocated | 7,100 | 5.9 | 4.3 | 6,707 |
| Relevant business indicators | 31-03-21 | ∆% | ∆% (1) | 31-12-20 |
|---|---|---|---|---|
| Performing loans and advances to customers under management (2) | 52,004 | 3.1 | 1.5 | 50,446 |
| Non-performing loans | 1,658 | (8.8) | (10.2) | 1,818 |
| Customer deposits under management (2) | 56,489 | 5.0 | 3.5 | 53,775 |
| Off-balance sheet funds (3) | 23,834 | 5.8 | 4.2 | 22,524 |
| Risk-weighted assets | 61,981 | 1.9 | 0.4 | 60,825 |
| Efficiency ratio (%) | 35.3 | 33.4 | ||
| NPL ratio (%) | 3.0 | 3.3 | ||
| NPL coverage ratio (%) | 129 | 122 | ||
| Cost of risk (%) | 3.55 | 4.02 |
(1) Figures at constant exchange rate.
(2) Excluding repos.
(3) Includes mutual funds and other off-balance sheet funds.
Unless expressly stated otherwise, all the comments below on rates of change, for both activity and results, will be given at constant exchange rate. These rates, together with changes at current exchange rates, can be found in the attached tables of financial statements and relevant business indicators.
Activity
The most relevant aspects related to the area's activity during the first quarter of 2021 were:
- Lending activity (performing loans under management) increased 1.5% in the quarter, mainly due to the positive performance in corporate banking loans (up 9.1%), which boosted growth in the wholesale portfolio (up 2.3%). The retail portfolio recorded a slight growth compared to the end of December 2020 (up 0.6%), mainly due to the continued positive performance of the mortgage portfolio (up 1.6%) and to the growth in the SME portfolio (up 3.1%) over the same period, which was supported by campaigns aimed at attracting customers and highlighting the bank’s digital products. As a result, BBVA Mexico's portfolio mix stands at 49% retail and 51% wholesale.
- With regard to asset quality indicators, the NPL ratio showed an improving trend throughout the quarter, falling 37 basis points to 3.0% at the end of the first quarter of the year, with a decrease in the balance of non-performing loans in consumer and credit card portfolios. The NPL coverage ratio increased in the quarter to 129%.
- Customer deposits under management showed an increase of 3.5% in the quarter, favored by growth in demand deposits of 4.2%, due to customers' preference of having liquid balances within an environment of uncertainty and falling rates due to the pandemic. Time deposits, however, remained flat during the quarter (up 0.3%). The above allows BBVA Mexico to improve its deposits mix, with an 81.4% of total deposits in lower-cost transactional funds. Off-balance sheet funds also performed well in the first quarter of 2021 (up 4.2%).
Results
BBVA Mexico achieved a net attributable profit of €493m in the first quarter of 2021, representing a 46.9% increase compared to the same quarter in the previous year. It should be noted that the first quarter of 2020 was historically atypical and there was a sharp increase in impairment on financial assets as a result of the worsening macroeconomic scenario following the outbreak of the COVID-19 pandemic in March 2020. The most relevant aspects related to the income statement are summarized below:
- Net interest income closed below the figure recorded in the first quarter of 2020 (down 1.8%), as a result of a year-on-year contraction in the portfolio, which has been hit by the effect of the pandemic given the global economic slowdown, and by lower reference rates applied.
- Net fees and commissions increased 5.8% thanks to increased billing, especially in credit cards, and thanks to investment banking fees.
- NTI showed a year-on-year decline of 1.9%, mainly due to losses in Global Markets positions and lower volumes of foreign exchange brokerage.
- The other operating income and expenses line recorded a year-on-year decrease of 34.2%, as a result of a greater contribution to the Deposit Guarantee Fund due to larger volumes deposited by customers and a lower contribution from the insurance business, explained by an increase in claims in the life insurance business as a result of the pandemic.
- Operating expenses increased (up 4.3%) due to additional disbursements in order to preserve the health and safety of employees and customers, as well as some expenses which were postponed due to the pandemic, and those expenses denominated in dollars affected by the depreciation of the Mexican peso.
- The impairment on financial assets line item decreased significantly compared to the same period of the last year (down 34.2%), mainly due to additional provisions for COVID-19 recorded in March 2020, derived from a worsening macroeconomic scenario compared to the scenario initially predicted at the beginning of the previous year. With regard to the cumulative cost of risk, it stood at 3.55% as of March 2021.
- The provisions and other results line showed a favorable comparison to the first quarter of 2020.