
Other information: Corporate & Investment Banking
Highlights
- Lending activity balances above pre-pandemic levels and reduced customer funds
- Growth of recurring income and good performance of NTI
- Efficiency ratio remains at low levels
- Significant reduction in the impairment on financial assets line, compared to 2020 which was strongly affected by the effects of the pandemic
Business activity (1)
(YEAR-TO-DATE CHANGE AT CONSTANT EXCHANGE RATES)

(1) Excluding repos.
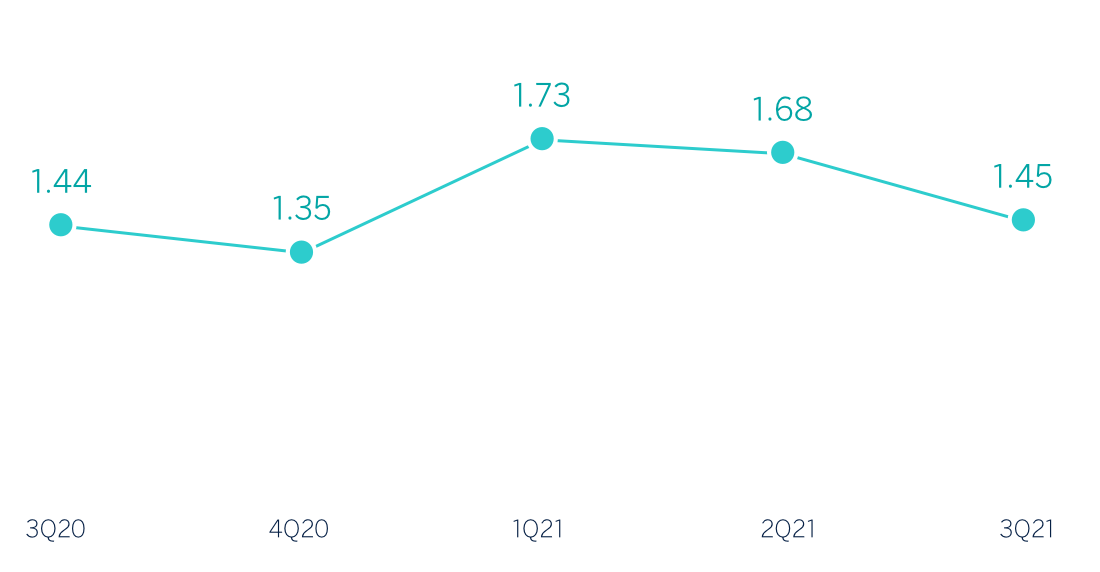
Gross income/ATAs
(Percentage. Constant exchange rates)
Operating income
(Millions of euros at constant exchange rates)
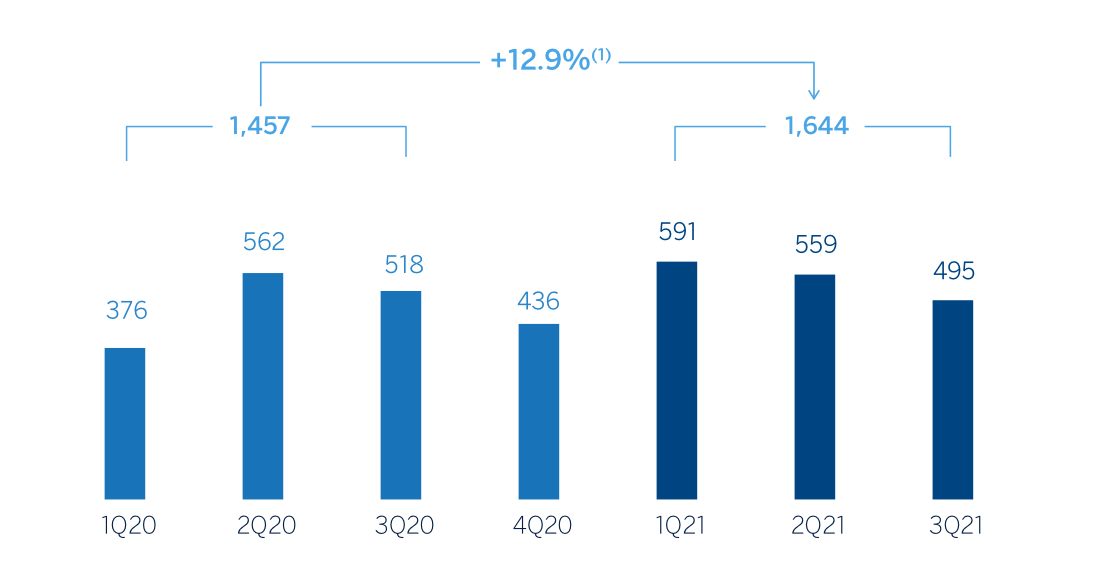
(1) At current exchange rates: +3.7%
Net attributable profit
(Millions of euros at constant exchange rates)

(1) At current exchange rates: +35.3%
Financial statements and relevant business indicators (Millions of euros and percentage)
| Income statement | Jan.-Sep. 21 | ∆% | ∆% (1) | Jan.-Sep. 20 |
|---|---|---|---|---|
| Net interest income | 1,156 | 4.0 | 11.2 | 1,111 |
| Net fees and commissions | 583 | 0.6 | 6.8 | 579 |
| Net trading income | 636 | 6.9 | 15.1 | 594 |
| Other operating income and expenses | (28) | (1.8) | 0.7 | (29) |
| Gross income | 2,346 | 4.0 | 11.2 | 2,256 |
| Operating expenses | (702) | 4.6 | 7.6 | (671) |
| Personnel expenses | (324) | 14.0 | 16.5 | (284) |
| Other administrative expenses | (296) | (0,9) | 3.3 | (299) |
| Depreciation | (81) | (7.1) | (6.9) | (88) |
| Operating income | 1,644 | 3.7 | 12.9 | 1,585 |
| Impairment on financial assets not measured at fair value through profit or loss | (13) | (96.2) | (95.7) | (343) |
| Provisions or reversal of provisions and other results | - | n.s. | n.s. | (44) |
| Profit/(loss) before tax | 1,631 | 36.1 | 46.6 | 1,199 |
| Income tax | (457) | 41.8 | 52.0 | (322) |
| Profit/(loss) for the period | 1,174 | 34.0 | 44.6 | 877 |
| Non-controlling interests | (220) | 28.6 | 56.1 | (171) |
| Net attributable profit/(loss) | 955 | 35.3 | 42.1 | 706 |
- (1) At constant exchange rates.
| Balance sheets | 30-09-21 | ∆% | ∆% (1) | 31-12-20 |
|---|---|---|---|---|
| Cash, cash balances at central banks and other demand deposits | 5,118 | (31.7) | (33.9) | 7,491 |
| Financial assets designated at fair value | 114,505 | 3.9 | 3.7 | 110,217 |
| Of which Loans and advances | 39,290 | 26.0 | 26.2 | 31,183 |
| Financial assets at amortized cost | 68,979 | (2.9) | (2.0) | 71,031 |
| Of which loans and advances to customers | 58,401 | (1.4) | (0.3) | 59,225 |
| Inter-area positions | - | - | - | - |
| Tangible assets | 39 | (20.8) | (20.9) | 50 |
| Other assets | 1,726 | 104.7 | 132.6 | 843 |
| Total assets/liabilities and equity | 190,368 | 0.4 | 0.6 | 189,632 |
| Financial liabilities held for trading and designated at fair value through profit or loss | 85,661 | (2.1) | (2.5) | 87,508 |
| Deposits from central banks and credit institutions | 15,308 | (4.1) | (4.3) | 15,958 |
| Deposits from customers | 36,686 | (14.6) | (14.0) | 42,966 |
| Debt certificates | 3,132 | 49.5 | 51.5 | 2,096 |
| Inter-area positions | 37,137 | 22.9 | 24.2 | 30,218 |
| Other liabilities | 2,907 | 37.9 | 30.6 | 2,108 |
| Regulatory capital allocated | 9,536 | 8.6 | 10.6 | 8,778 |
- (1) At constant exchange rates.
| Relevant business indicators | 30-09-21 | ∆% | ∆% (1) | 31-12-20 |
|---|---|---|---|---|
| Performing loans and advances to customers under management (2) | 57,576 | (0.2) | 0.9 | 57,704 |
| Non-performing loans | 1,647 | 29.2 | 42.1 | 1,275 |
| Customer deposits under management (2) | 36,037 | (14.8) | (14.2) | 42,313 |
| Off-balance sheet funds (3) | 1,165 | 13.2 | 19.5 | 1,030 |
| Efficiency ratio (%) | 29.9 | 31.4 |
- (1) At constant exchange rates.
- (2) Excluding repos.
- (3) Includes mutual funds, pension funds and other off-balance sheet funds.
Unless expressly stated otherwise, all the comments below on rates of change, for both activity and results, will be given at constant exchange rates. These rates, together with changes at current exchange rates, can be found in the attached tables of financial statements and relevant business indicators.
Activity
The most relevant aspects related to the area's activity between January and September 2021 were:
- Lending activity (performing loans under management) remains above the level prior to the outbreak of the pandemic in March 2020, with a slight increase (+0.9%) compared to the end of the same year. By geographical areas, Asia, Turkey and, to a lesser extent, South America showed positive evolution during the period.
- Customer funds fell by 13.4% in the first nine months of 2021, due to some transactions originated in the last months of 2020 that had not been renewed in 2021, being this trend widespread in all business areas, except for Mexico, which recorded a growth of 3.8% between January and September 2021.
The most significant aspects of the evolution in the area's activity in the third quarter of 2021 were:
- Lending activity (performing loans under management) remained stable in the quarter (+0.9%), mainly due to the good performance in Asia and Turkey.
- Customer funds decreased slightly in the quarter (-0.8%) due to lower customer deposits balances (-1.0%) in Turkey and South America.
Results
CIB generated a net attributable profit of €955m between January and September 2021, which represents and increase of 42.1% on a yea-to-year basis, thanks to the growth in recurring income and NTI as well as lower provisions for impairment on financial assets, which increased significantly in 2020 due to the COVID-19 pandemic.
The most relevant aspects of the year-on-year evolution in the income statement of Corporate & Investment Banking are summarized below:
- Net interest income sustained double-digit growth (+11.2%), supported by the evolution in Spain, Mexico and Turkey. In addition to the performance of lending activity, where a lower volume is observed, it is worth noting the commercial effort to adjust the price of certain transactions, one of the strategic focuses of the area in 2021, which has led to an improvement in profitability per transaction.
- Growth was also observed in net fees and commissions (+6.8%), mainly due to the performance of investment and transactional banking, the latter benefiting from the reactivation of business in 2021. On the contrary, Global Markets' operations have slowed down due to the access to the primary market by some customers. By geographical areas, positive performance of Mexico, South America and Turkey stood out.
- NTIcontinued showing a good performance, due to the proper management of market positions, with a very strong first and second quarter, while the third quarter of 2021 was affected by the seasonality in Spain and lower results in Mexico and Peru.
- The operating expense increased by 7.6% between January and September, in a year-on-year comparison affected by the supportive schemes implemented by the area in 2020 which have not occur in 2021 after the return to normality, although the area continues to focus its efforts on vacancy management and discretionary expenses.
- Provisions for impairment on financial assets decreased significantly compared with the same period last year, with the third quarter of 2021 highly benefiting from improved outlook, compared to 2020 which was severely affected by provisions related to COVID-19.
In the third quarter of 2021 and excluding the exchange rate effect, the Group’s wholesale businesses as a whole generated a net attributable profit of €316m (-1.1% compared to the previous quarter). This development is mainly explained by a decrease in NTI in the quarter, as previously mentioned, affected by seasonality in Spain and lower results in Mexico and Peru, offset in part by better performance in net interest income, mainly thanks to the results of Global Markets in Mexico, sustained expenses and, in particular, the reversals in the impairment on financial assets, mainly originated in Turkey.