
Rest of Business
Highlights
- Increase in lending due to quarterly performance and the decrease in customer funds between January and September, with growth in the third quarter
- Favorable performance of risk indicators in the quarter
- Continued good performance of net interest income from the branches in Asia and the NTI from the area as a whole
- Reversal in the impairment on financial assets line, which compares to a 2020 strongly affected by the outbreak of the pandemic
Business activity (1)
(Year-to-date change, at constant exchange rates)
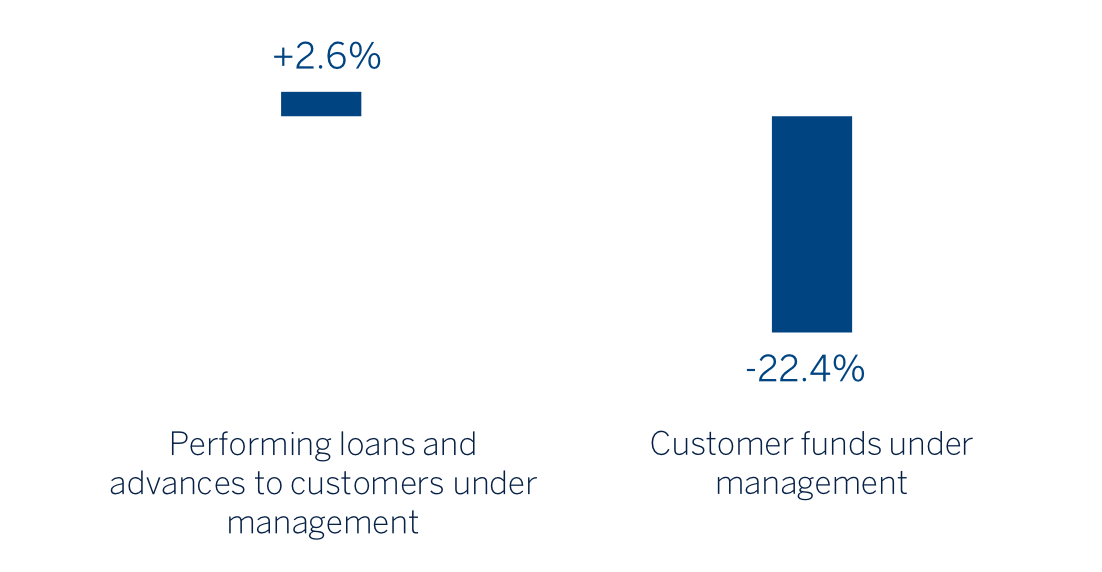
(1) Excluding repos.
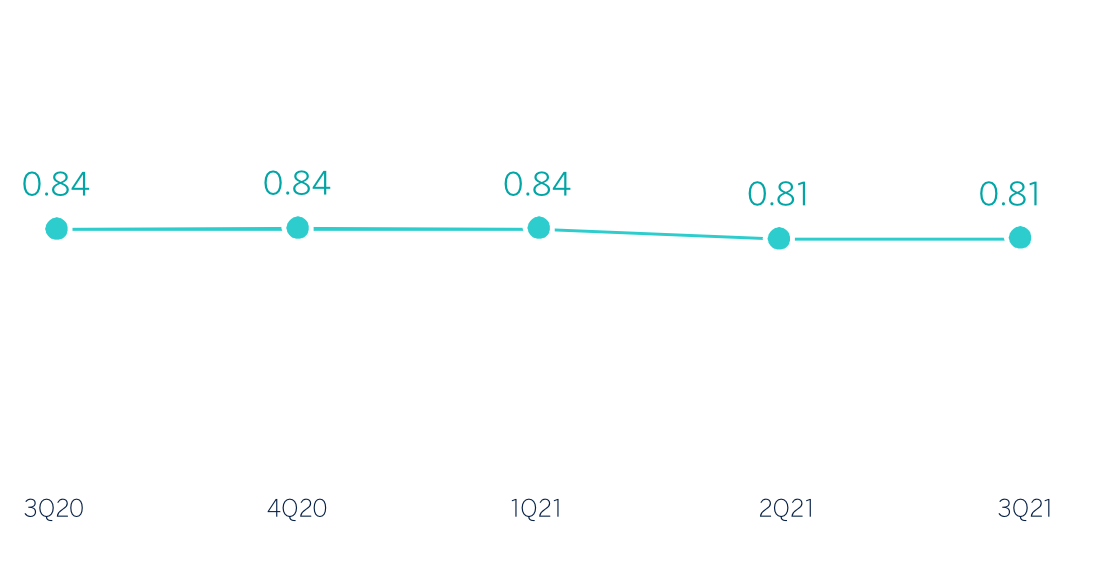
Net interest income/ATAs
(Percentage. Constant exchange rates)
Operating income
(Millions of euros at constant exchange rate)
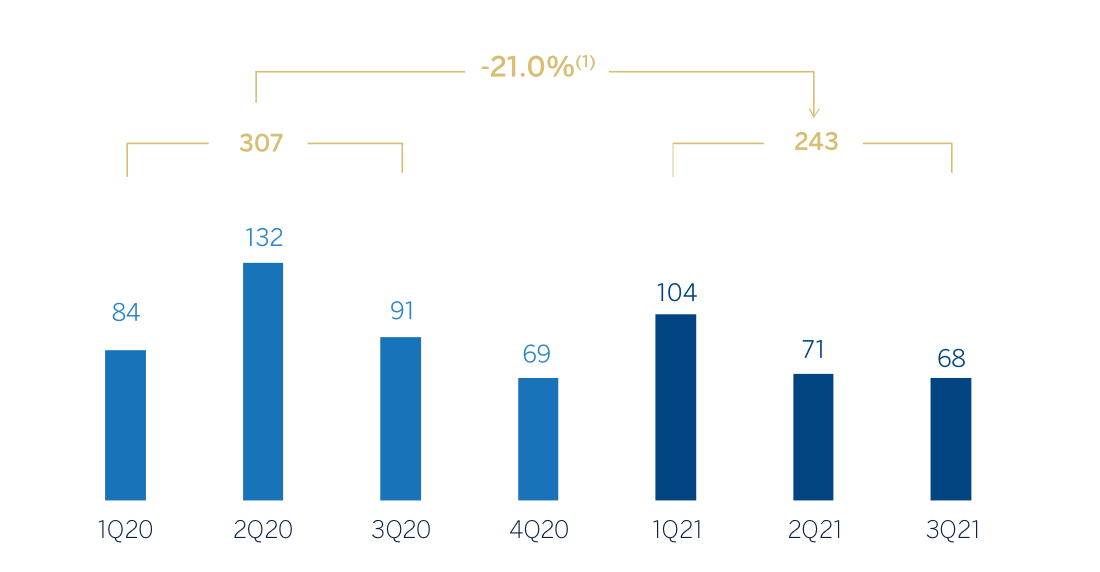
(1) At current exchange rates: -21.4%
Net attributable profit
(Millions of euros at constant exchange rate)
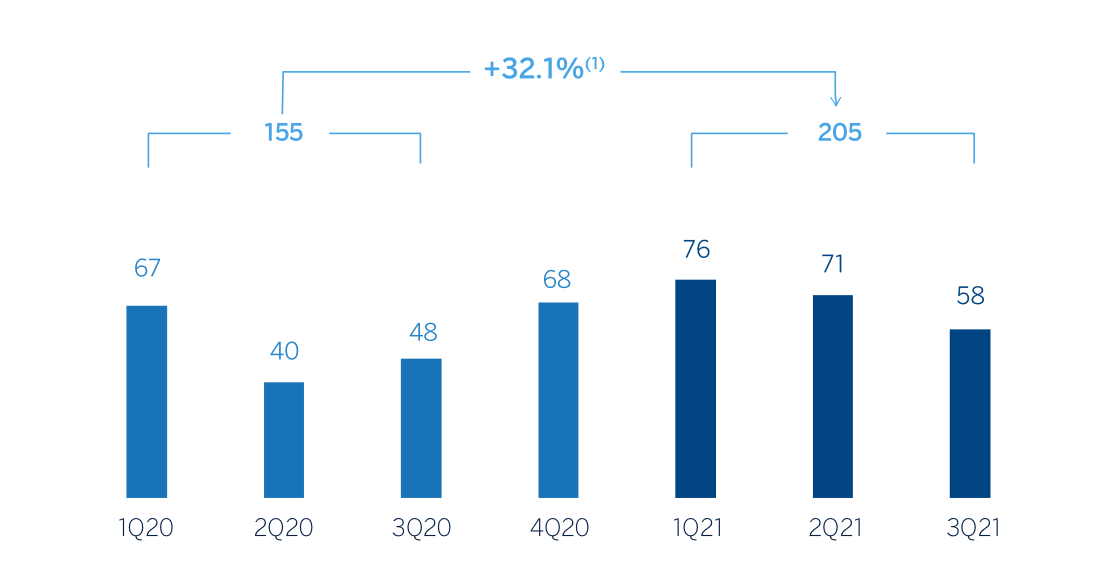
(1) At current exchange rates: +30.6%
Financial statements and relevant business indicators (Millions of euros and percentage)
| Income statement | Jan.-Sep 21 | ∆% | ∆% (1) | Jan.-Sep 20 |
|---|---|---|---|---|
| Net interest income | 209 | (4.9) | (5.1) | 220 |
| Net fees and commissions | 189 | (28.3) | (26.4) | 263 |
| Net trading income | 156 | 17.6 | 17.6 | 133 |
| Other operating income and expenses | 14 | (59.2) | (57.9) | 34 |
| Gross income | 568 | (12.6) | (11.6) | 650 |
| Operating expenses | (325) | (4.7) | (3.0) | (341) |
| Personnel expenses | (165) | (11.1) | (8.9) | (185) |
| Other administrative expenses | (145) | 3.4 | 4.3 | (140) |
| Depreciation | (16) | 0.1 | 0.7 | (15) |
| Operating income | 243 | (21.4) | (21.0) | 309 |
| Impaiment on financial assets not measured at fair value through profit or loss | 20 | n.s. | n.s. | (100) |
| Provisions or reversal of provisions and other results | (4) | (66.5) | (66.6) | (11) |
| Profit/(loss) before tax | 259 | 30.6 | 32.1 | 198 |
| Income tax | (54) | 30.8 | 32.1 | (41) |
| Profit/(loss) for the period | 205 | 30.6 | 32.1 | 157 |
| Non-controlling interests | - | - | - | - |
| Net attributable profit/(loss) | 205 | 30.6 | 32.1 | 157 |
| Balance sheets | 30-09-21 | ∆% | ∆% (1) | 31-12-20 |
|---|---|---|---|---|
| Cash, cash balances at central banks and other demand deposits | 4,454 | (27.2) | (31.2) | 6,121 |
| Financial assets designated at fair value | 2,544 | 73.1 | 66.5 | 1,470 |
| Of which: Loans and advances | 1,456 | n.s. | n.s. | 153 |
| Financial assets at amortized cost | 28,507 | 4.8 | 3.5 | 27,213 |
| Of which: Loans and advances to customers | 24,995 | 4.1 | 2.8 | 24,015 |
| Inter-area positions | - | - | - | - |
| Tangible assets | 65 | (13.5) | (14.1) | 75 |
| Other assets | 363 | 24.0 | 21.7 | 293 |
| Total assets/liabilities and equity | 35,933 | 2.2 | 0.1 | 35,172 |
| Financial liabilities held for trading and designated at fair value through profit or loss | 1,905 | 124.4 | 112.4 | 849 |
| Deposits from central banks and credit institutions | 1,798 | 5.8 | 2.7 | 1,700 |
| Deposits from customers | 7,341 | (21.3) | (23.6) | 9,333 |
| Debt certificates | 1,249 | (17.4) | (18.3) | 1,511 |
| Inter-area positions | 19,535 | 7.7 | 6.1 | 18,132 |
| Other liabilities | 799 | 31.4 | 29.0 | 608 |
| Economic capital allocated | 3,307 | 8.8 | 7.0 | 3,039 |
| Relevant business indicators | 30-09-21 | ∆% | ∆% (1) | 31-12-20 |
|---|---|---|---|---|
| Performing loans and advances to customers under management (2) | 24,979 | 3.9 | 2.6 | 24,038 |
| Non-performing loans | 317 | (2.3) | (2.8) | 324 |
| Customer deposits under management (2) | 7,341 | (21.3) | (23.6) | 9,333 |
| Off-balance sheet funds (3) | 567 | (0.5) | (0.5) | 569 |
| Risk-weighted assets | 27,193 | 11.8 | 10.1 | 24,331 |
| Efficiency ratio (%) | 57.2 | 55.6 | ||
| NPL ratio (%) | 0.9 | 1.0 | ||
| NPL coverage ratio (%) | 98 | 109 | ||
| Cost of risk (%) | (0.11) | 0.30 |
(1) At constant exchange rates.
(2) Excluding repos.
(3) Includes pension funds.
Unless expressly stated otherwise, all the comments below on rates of change, for both activity and results, will be given at constant exchange rates. These rates, together with the changes at current exchange rates, can be found in the attached tables of the financial statements and relevant business indicators. Comments that refer to Europe exclude Spain.
Activity
The most relevant aspects of the activity of Rest of Business of BBVA Group during the first nine months of 2021 were:
- Lending activity (performing loans under management) increased during the first nine months of the year (+2.6%), thanks to the business growth of the BBVA's branches located in Asia.
- Regarding credit risk indicators, the NPL ratio stood at 0.9%, 8 basis points below the end of June 2021 due to an improvement in the behavior of non-performing loans in Europe, improving the coverage rate to 98%.
- Customer deposits under management decreased by 22.4% mainly due to a decrease in deposits from wholesale customers in the New York branch.
The most relevant developments in the area’s activity in the third quarter of 2021 were:
- Lending activity (performing loans under management) increased by 2.6% compared to the previous quarter due to the favorable performance of lending to the public sector, mainly in Asia.
- Total customer deposits under management increased in the quarter (+5.5%) thanks to the growth of demand deposits (+9.6%) in Europe, excluding Spain.
Results
The most significant aspects of the year-on-year evolution in the area's income statement at the end of September 2021 are the following:
- The net interest income decreased -5.1% compared to the same period of the previous year, mainly due to the evolution of the New York branch.
- Net commissions fell by 26.4% compared to the end of September 2020, due to lower issuance and advisory fees in Europe and, in particular, due to lower contribution from BBVA Securities, the Group's broker-dealer in the United States.
- The NTI line increased (+17.6% year-on-year) driven by a better performance of BBVA Securities, the business in Europe and branches in Asia.
- Year-on-year decrease in operating expenses (-3.0% year-on-year) due to lower expenses recorded by BBVA Securities.
- The impairment on financial assets line closed September with a reversal of €20m, which positively compares against the €-100m recorded twelve months earlier, mainly explained by the positive evolution of impaired clients of the New York branch and the retail portfolio in Europe.
- As a result, the area's cumulative net attributable profit between January and September 2021 was €205m (+32.1% year-on-year).
In the third quarter of 2021, the Group’s Rest of Business as a whole generated a net attributable profit of €58 million (-17.2% compared to the previous quarter) as a result of lower fees and commissions (-16.1%), a negative result in the other operating income and operating expenses line that contrasts with the positive result of the previous quarter, as well as lower reversals in the impairment on financial assets and provisions line. This was partly offset by a reduction in operating expenses (-13.9%) and a lower effective tax rate.