

7. Risk management
The BBVA Group understands the risk management function as one of the essential and differentiating elements of its competitive strategy. In this context, the aim of the Global Risk Management (GRM) Corporate Area is to preserve the BBVA Group’s solvency, help define its strategy with respect to risk and assume and facilitate the development of its businesses. Its activity is governed by the following principles:
- The risk management function is single, independent and global.
- The risks assumed by the BBVA Group must be compatible with the capital adequacy target and must be identified, measured and assessed. Risk monitoring and management procedures and sound mechanisms of control and mitigation systems must likewise be in place.
- All risks must be managed integrally during their life cycle, and be treated differently depending on their nature and with active portfolio management based on a common measure (economic capital).
- It is each operating segment’s responsibility to propose and maintain its own risk profile, within its autonomy in the corporate action framework (defined as the set of risk control policies and procedures defined by the BBVA Group), using an appropriate risk infrastructure to control their risks.
- The infrastructures created for risk control must be equipped with means (in terms of people, tools, databases, information systems and procedures) that are sufficient for their purpose, so that there is a clear definition of roles and responsibilities, thus ensuring efficient allocation of resources among the corporate area and the risk units in operating segments.
In light of these principles, integrated risk management is structured around five main components:
- A governance and organizational system for the risk function, which considers:
- Definition of roles and responsibilities for different functions and areas
- Organizational structure of the GRM Corporate Area and Risk Units of the operating segments, including relationship and codependency mechanisms
- Committee Schemes at a Corporate and operating segment levels
- Structure delegation of functions and risks
- Internal control system in line with the nature and volume of risk exposure
- A general risk framework, where the Group’s risk profile objective is defined and where the tolerance levels that the Group is willing to assume is clearly defined in order to carry out its strategic plan without relevant deviations, even in stress situations.
- A risk management corporate governance scheme which includes:
- a regulatory body of policies and procedures, tolerances and corrective actions
- Annual risk planning scheme whereby Risk Appetite is incorporated into the Group’s business decision making process
- ongoing management of financial and non-financial risks
- A Framework for Identification, Assessment, Monitoring and Reporting of risks assumed in base and stress scenarios, allowing prospective and dynamic risk assessment
- An infrastructure that encompasses the set of tools, methodologies and risk culture that is the basis on which the differentiated risk management scheme is founded.
Corporate governance system
The BBVA Group has developed a corporate governance system in line with the best international practices, which adapts to the regulatory requirements of the countries where its operating segments carry out their business.
The Board of Directors is, in accordance with the Regulations of the Board, the body responsible for approving the policy control and risk management, as well as performing the periodic monitoring of internal information and control systems. Based on the general policies established by the Board of Directors, the Executive Committee (EC) sets corporate policies that previously been approved by the Board of Directors and the Group's risk limits by geographies, sectors and portfolios composing all the corporate action framework on risk . In this context, and for the adequate performance of its functions, the EC has a key role in developing the Risk Committee of the Board which, among other functions, analyzes and evaluates proposals on these issues that are risen to the EC for approval, performing a continuous monitoring of risk evolution and approving transactions that are considered relevant for qualitative or quantitative reasons.
Risk management in the BBVA Group from a corporate action framework set by the governing bodies of the Bank is carried out by corporate risk management units and the operating segments themselves. Thus, the risk function in the Group (Global Risk Management , hereinafter GRM) , is distributed among the risk units of the operating segments and the GRM corporate area, the latter being responsible for ensuring compliance with policies and global strategies. The risk units of the operating segments advise and manage risk profiles within their autonomy, though they always respect the corporate framework for action.
The Corporate GRM Area combines a vision by risk type with a global vision. It is divided into six units, as follows:
- Corporate Risk Management and Risk Portfolio Management: Responsible for management and control of the BBVA Group’s financial risks. In addition, this area focuses on fiduciary risk management, insurance, Asset Management and monitors the retail banking business from a cross functional point of view.
- Operational and Control Risk: Manages operational risk, internal risk area control and the internal validation of the measurement models and the acceptance of new risks.
- Technology & Methodologies: Responsible for the management of the technological and methodological developments required for risk management in the Group.
- Technical Secretariat: Undertakes the contrast of the proposals made to the Risk Management Committee and the Risk Committee.
- Planning, Monitoring & Reporting: Responsible for the development of the ERM framework and the definition and monitoring of risk appetite. It also prepares reporting requirements, both internal and regulatory, for those risks the Group is exposed to.
- GRM South America: Responsible for credit risk management and monitoring in South America.
The head of the GRM Department is the Chief Risk Officer, and, among his responsibilities, ensures that the Group's risks are managed according to the defined policy, relying on the GRM corporate area units and the risk units of the operating segments. In turn, the risk managers of the operating segments maintain a hierarchical reporting line with the head of their operating segment and a functional reporting to the Group Chief Risk Officer. This structure ensures the independence of the role of local risk and alignment with the policies and objectives of the Group. This structure gives the Corporate GRM Area reasonable comfort with respect to:
- integration, control and management of all the Group’s risks;
- the application throughout the Group of standard principles, policies and metrics; and
- the necessary knowledge of each geographical area and each business.
This organizational scheme is complemented by various committees, which include the following:
- The Global Risk Management Committee: This committee is made up of the risk managers from the risk units located in the operating segments and the managers of the GRM Corporate Area units. This committee meets on a monthly basis and among its responsibilities are the following:
- establishing the Group’s risk strategy and presenting its proposal to the appropriate governing bodies, and in particular to the Board of Directors, for their approval,
- monitoring the management and control of risks in the Group, and
- adopting any necessary actions.
- The Risk Management Committee: Its permanent members are the Global Risk Management director, the Corporate Risk Management director and the Technical Secretariat. The other committee members propose the operations that are analyzed in its working sessions. The committee analyzes and, if appropriate, authorizes financial programs and operations within its scope and submits the proposals whose amounts exceed the set limits to the Risks Committee, when its opinion on them is favorable.
- The Assets and Liabilities Committee (ALCO): The committee is responsible for actively managing structural interest rate and foreign exchange risk positions, global liquidity and the Group’s capital base.
- The Technology and Methodologies Committee: The committee decides on the effectiveness of the models and infrastructures developed to manage and control risks that are integrated in the operating segments, within the framework of the operational model of Global Risk Management.
- The New Businesses and Products Committees: Their functions are to analyze and, where appropriate, give technical approval to and implement new businesses, products and services prior to their marketing: to undertake subsequent control and monitoring of new authorized products; and to foster orderly business operations to ensure they develop in a controlled environment.
- The Global Corporate Assurance Committee: Its task is to undertake a review at both Group and operating segment level of the control environment and the effectiveness of the operational risk internal control and management systems, as well as to monitor and analyze the main operational risks the Group is subject to, including those that are cross-cutting in nature.
Internal control system
The BBVA Group’s internal control system is based on the best practices developed in “Enterprise Risk Management – Integrated Framework” by the Committee of Sponsoring Organizations of the Treadway Commission (COSO) as well as in “Framework for Internal Control Systems in Banking Organizations” by the Bank for International Settlements (BIS). The Group’s system for internal control is therefore part of the Integral Risk Management Framework.
The system of internal control of the Group reaches all areas of the organization and is designed to identify and manage the risks that the Group companies are facing and ensuring that the corporate objectives are met.
The control model has a three-line defense system:
- The first line is formed by the Group's operating segments, which are responsible for the control within their scope and implementation of the measures set by higher authorities.
- The second line are the specialists control units (Compliance, Global Accounting & Informational Management / Financial Internal Control , Risk Internal Control, IT Risk , Fraud & Security, Operational Control and production director support units , such as Human Resources , Legal , etc. ...). This line supervises the control of the different units from a horizontal hierarchy stand point. Also, reporting to this line is the operational risk corporate management unit, which provides a common methodology and management tools.
- The third line is the Internal Audit unit, which conducts an independent review of the model, verifying compliance and effectiveness of corporate policies and providing independent information on the control model.
Find following list shows the main principles that support the internal control system:
- Its core element is the “process.”
- The form in which the risks are identified, assessed and mitigated must be unique for each process; and the systems, tools and information flows that support the internal control and operational risk activities must be unique, or at least be administered fully by a single unit.
- The responsibility for internal control lies with the BBVA Group’s operating segments. These units, along with the specialized units mentioned above, are responsible for the implementation of the system of control within its scope of responsibility and managing the existing risk by proposing any improvements to processes it considers appropriate.
- Given that some operating segments have a global scope of responsibility, there are cross-cutting control functions which supplement the control mechanisms mentioned earlier.
- The Operational Risk Management Committee in each operating segment is responsible for approving suitable mitigation plans for each existing risk or weakness. This committee structure culminates at the Group’s Global Corporate Assurance Committee.
Within the GRM area, the Group has set up a unit of Internal Risk Control and Risk Validation that is independent from the units that develop models, manage processes and execute controls, and provide expert resources for the management of the different types of risks. Its objectives are:
- Ensure that there is a policy, process and measures identified for each risk relevant to the group.
- Ensure that these are implemented and applied in the manner in which they were defined.
- Control and communication any identified deficiencies and setting goals for improvement.
- Internal validation of models, independent from the model development process.
Both units report their activities and report their working plans to the Risk Committee of the Board.
The Internal Risk Control is built into the second line of defense. It has a global scope, both geographically and in terms of type of risk, reaching to all those risk types managed by the Corporate Risk Area. For the development of its function, the unit has a team structure at the corporate level and at the geography level in the case of the most important geographies in which the Group operates. As in the Corporate Area, the local units are maintained independent from the operating segment processes and from those units that execute controls. It maintains however a functional dependency to the Internal Risk control unit. The lines of action of this unit are set at a Group level, adapting and executing at a local level as well as reporting the most relevant aspects.
Risk Appetite Framework
The Group Risk policy is aimed towards a moderate risk profile through conservative management and a global banking business model diversified by geographical area, type of assets, portfolios and customers. The Group has a large international presence, both in emerging and developed countries, maintaining a medium/low risk profile in each geography while seeking sustainable growth over time.
In order to achieve the above, a number of key metrics have been established that characterize the objective of the entity behavior and are enforced across the organization. These metrics are related to the solvency, liquidity and recurrence of results; and depending on the circumstances prevailing in each case, determine the risk in the Group and allow to reach the desired objectives.
Tolerance levels for key metrics are proposed by the GRM and approved by the Executive Committee. These metrics define the risks that the group is willing to assume. They defined the Group’s Risk Appetite and therefore are considered permanent save for exceptions.
Also, on an annual basis, the Executive Committee establishes, after a proposal from GRM and favorable report of the Risk Committee, limits for the main types of risks present in the Group, such as credit, liquidity, funding and market. The compliance with these limits is monitored periodically through Risk committees. For credit risk, limits are defined at portfolio and/or sector level for each operating segment. In credit risk limits defined portfolio level and / or sector and for each operating segment. These thresholds are the maximum exposure to lending for the BBVA Group for a time horizon of one year.
The Group's objective is not to eliminate all risks, but to take a prudent level of risk that will generate results while maintaining adequate levels of capital and funding in order to generate recurring profits.
Corporate Scheme of Risk Management
Corporate Scheme of Risk Management includes macro processes as detailed below:
- Regulatory enhancement process for the Risk area. GRM has established a set of principles, policies and procedures that serve as foundation to the regulatory structure of the risk function. The objectives are:
- Consistency of all policies of the Group, Holding and local level, with the guiding principles of risk appetite and within themselves.
- Uniformity between the operating segments in the implementation of risk policies, avoiding disparities in the risks taken based on the operating segment.
- Framework of action, establishing the general lines of action for the operating segments, respecting the autonomy of these units.
- Annual Planning Process: Planning is done taking into account the risk appetite and establishes a series of limits by type of asset that ensure consistency with the global objective profile of the Group's risk.
- Management of the main risks which are faced by the Group are the following:
- Credit risk:
This arises from the probability that one party to a financial instrument will fail to meet its contractual obligations for reasons of insolvency or inability to pay and cause a financial loss for the other party. This includes management of counterparty risk, issuer credit risk, liquidation risk and country risk.
Management of credit risk covers the analytic process before decisions have been taken, decision making, instrumentation, monitoring formalized and recovery operations, as well as the entire process of control and reporting at customer level, segment, industry, operating segment or subsidiary. The main principles on which decision-making should be supported within credit risk are: a sufficient customer generation of resources and capital solvency and the existence of adequate and effective collateral. The management of credit risk in the Group has a comprehensive structure that allows all functions making decisions objectively and independently throughout the life cycle risk.
- Market risk:
This is originated by the likelihood of losses in the value of the positions held as a result of changes in the market prices of financial instruments. The BBVA Group manages this risk in terms of probability of VaR (Value at Risk). It includes three types of risks:
- Interest-rate risk: This arises from variations in market interest rates.
- Exchange Rate risk: This is the risk resulting from variations in foreign-currency exchange rates.
-
Price risk: This is the risk resulting from variations in market prices, either due to factors specific to the instrument itself, or alternatively to factors which affect all the instruments traded on a specific market.
- Liquidity risk
Control, monitoring and management of liquidity risk and funding aims in the short term, ensuring compliance with payment obligations of the BBVA Group in the time and manner provided, without the need to obtain funds under unfavorable conditions. In the mid-term it aims to ensure the adequacy of the Group's financial structure and its evolution in the context of the economic, market and regulatory changes.
- Structural risk, includes the following:
- Interest rate structural risk: The management of this kind of risk seeks to maintain exposure levels for the BBVA Group in line with its strategy and risk profile to address changes in market interest rates. For this aim, ALCO carries out an active balance sheet management through operations intended to optimize the level of risk in relation to the expected results and with respect to the maximum tolerable risk levels. The activity of the ALCO uses the interest rate risk measurements performed by the Corporate Area GRM.
- Exchange rate structural risk: This risk arises primarily from exposure to changes in exchange rates arising from foreign companies to the BBVA Group and endowment funds to branches abroad financed in a different currency the investment. Managing this risk is based on a simulation model of scenarios to quantify the changes in value that can be produced with a given confidence level and a horizon predetermined, and ALCO is the responsible for arranging hedging transactions, to restrict the equity impact due to the changes in exchange rates according to their projected trend.
-
Structural equity risk: This risk arises due to the possible negative impact due to the impairment value of its investments in Industrial and Financial entities with medium and long horizons. The Corporate area GRM is responsible for measurement and effective monitoring of the structural risk of equity, estimating for this reason the sensitivity and the capital required to cover any unexpected losses arising from changes in value of the companies comprising the investment portfolio of the Group, with a confidence level in accordance with the target entity rating, taking into account liquidity positions and the statistical behavior of the assets under consideration.
- Operational risk:
This arises from the possibility of human error, inadequate or faulty internal processes, system failures or external events. This definition includes the legal risk and excludes strategic and/or business risk and reputational risk The operational risk management in the Group is based on the levers of value that generates advanced AMA (advanced measurement approach): knowledge, identification, prioritization and management of potential and actual risks, supported by indicators to analyze the evolution, define alerts and check the controls.
Framework for identifying, analyzing and monitoring risk
The process of identification, assessment and monitoring / reporting have the following objectives:
- Evaluate the performance of risk appetite in the present moment.
- Identified and evaluate risk situation that may compromise the performance of the risk appetite.
- Evaluate the performance of risk appetite to future under basis and stress scenario.
Infrastructure: Technology, Culture and Risk Methodologies
- Technology: assessing the adequacy of information systems and technology necessary for the performance of the functions within the framework of integrated risk management of the Group.
- The BBVA Group’s main activities with respect to the management and control of its risks are as follows:
- Calculation of exposure to risks of the different portfolios, taking into account any possible mitigating factors (guarantees, balance netting, collaterals, etc.).
- Calculation of the probabilities of default (hereinafter, “PD”).
- Estimation of the foreseeable losses in each portfolio, assigning a PD to new operations (rating and scoring).
- Measurement of the risk values of the portfolios in different scenarios through historical simulations.
- Establishment of limits to potential losses according to the different risks incurred.
- Determination of the possible impacts of structural risks on the BBVA Group’s consolidated income statement.
- Identification and quantification of operational risks, by operating segments, to facilitate mitigation through appropriate corrective actions.
- Risk Culture
In accordance with best practice and in line with recent regulatory recommendations, BBVA has implemented a robust risk culture that spreads all levels of the organization so that principles of risk management could be unique, and known throughout the group.
Global Risk Management Risk Culture diffuses as a value and as a fundamental part of its management model, with the aim to strengthening the direction of the risk management, emphasizing that this culture could be communicated, understood, accepted and controlled throughout the organization.
Risk Culture has opted for three different areas:
- Communication, which aims to spread understanding of the Risk Management Framework of the Group consistently and integrated throughout the organization through the most appropriate channels of communication.
- Training, in which specific formats have been developed to raise awareness of risks in the organization and ensure certain standards in skills and knowledge of Risk Management
- Compensation, area where it is intended that the financial and non-financial incentives could support the values and culture of risk at all levels and for which they have been established mechanisms based on the risk management, in accordance with the objectives established by the Group.
It has been established continuously monitored to verify proper implementation of these areas and their development.
7.1 Credit risk
7.1.1 Credit risk exposure
In accordance with IFRS 7, the BBVA Group’s maximum credit risk exposure (see definition below) by headings in the balance sheet as of December 31, 2013, 2012 and 2011 is provided below. It does not consider the availability of collateral or other credit enhancements to guarantee compliance with payment obligations. The details are broken down by financial instruments and counterparties.
 Download Excel
| Maximum Credit Risk Exposure | Millions of Euros | |||
|---|---|---|---|---|
| Notes | 2013 | 2012 | 2011 | |
| Financial assets held for trading |
|
29,708 | 28,265 | 20,946 |
| Debt securities | 10 | 29,602 | 28,020 | 20,946 |
| Government |
|
24,696 | 23,370 | 17,955 |
| Credit institutions |
|
2,734 | 2,545 | 1,889 |
| Other sectors |
|
2,172 | 2,106 | 1,102 |
| Customer lending |
|
106 | 244 | - |
| Other financial assets designated at fair value through profit or loss |
|
664 | 753 | 708 |
| Debt securities | 11 | 664 | 753 | 708 |
| Government |
|
142 | 174 | 129 |
| Credit institutions |
|
16 | 45 | 44 |
| Other sectors |
|
506 | 534 | 535 |
| Available-for-sale financial assets |
|
71,439 | 62,615 | 48,507 |
| Debt securities | 12 | 71,439 | 62,615 | 48,507 |
| Government |
|
48,728 | 38,926 | 32,476 |
| Credit institutions |
|
10,431 | 13,157 | 7,067 |
| Other sectors |
|
12,280 | 10,532 | 8,964 |
| Loans and receivables |
|
364,030 | 384,097 | 377,519 |
| Loans and advances to credit institutions | 13.1 | 22,792 | 25,372 | 24,400 |
| Loans and advances to customers | 13.2 | 336,759 | 354,973 | 350,239 |
| Government |
|
32,400 | 34,917 | 34,941 |
| Agriculture |
|
4,982 | 4,738 | 4,697 |
| Industry |
|
28,679 | 30,731 | 34,834 |
| Real estate and construction |
|
40,486 | 47,223 | 49,418 |
| Trade and finance |
|
47,169 | 51,912 | 54,736 |
| Loans to individuals |
|
149,891 | 151,244 | 137,437 |
| Other |
|
33,151 | 34,208 | 34,176 |
| Debt securities | 13.3 | 4,481 | 3,751 | 2,880 |
| Government |
|
3,175 | 2,375 | 2,128 |
| Credit institutions |
|
297 | 453 | 461 |
| Other sectors |
|
1,009 | 923 | 291 |
| Held-to-maturity investments | 14 | - | 10,163 | 10,955 |
| Government |
|
- | 9,210 | 9,896 |
| Credit institutions |
|
- | 393 | 451 |
| Other sectors |
|
- | 560 | 608 |
| Derivatives (trading and hedging) |
|
41,294 | 49,208 | 53,561 |
| Subtotal |
|
507,135 | 535,101 | 512,196 |
| Valuation adjustments |
|
1,068 | 338 | 530 |
| Total Financial Assets Risk |
|
508,203 | 535,439 | 512,726 |
|
|
|
|
|
|
| Financial guarantees (Bank guarantees, letter of credits,..) |
|
33,543 | 37,019 | 37,629 |
| Drawable by third parties |
|
87,542 | 83,519 | 86,375 |
| Government |
|
4,354 | 1,360 | 3,143 |
| Credit institutions |
|
1,583 | 1,946 | 2,417 |
| Other sectors |
|
81,605 | 80,213 | 80,815 |
| Other contingent commitments |
|
6,628 | 6,624 | 4,313 |
| Total Contingent Risks and Commitments | 34 | 127,713 | 127,161 | 128,317 |
| Total Maximum Credit Exposure |
|
635,916 | 662,601 | 641,043 |
The maximum credit exposure of the table above is determined by type of financial asset as explained below:
- In the case of financial assets recognized in the consolidated balance sheets, exposure to credit risk is considered equal to its gross accounting value, not including certain valuation adjustments (impairment losses, derivatives and others), with the sole exception of trading and hedging derivatives.
- The maximum credit risk exposure on financial guarantees granted is the maximum that the Group would be liable for if these guarantees were called in, and that is their carrying amount.
- Our calculation of risk exposure for derivatives is based on the sum of two factors: the derivatives market value and their potential risk (or "add-on").
The first factor, market value, reflects the difference between original commitments and market values on the reporting date (mark-to-market). As indicated in Note 2.2.1 to the consolidated financial statements, derivatives are accounted for as of each reporting date at fair value in accordance with IAS 39.
The second factor, potential risk (‘add-on’), is an estimate (using internal models) of the maximum increase to be expected on risk exposure over a derivative market value (at a given statistical confidence level) as a result of future changes in the fair value over the remaining term of the derivatives.
The consideration of the potential risk ("add-on") relates the risk exposure to the exposure level at the time of a customer’s default. The exposure level will depend on the customer’s credit quality and the type of transaction with such customer. Given the fact that default is an uncertain event which might occur any time during the life of a contract, the BBVA Group has to consider not only the credit exposure of the derivatives on the reporting date, but also the potential changes in exposure during the life of the contract. This is especially important for derivatives, whose valuation changes substantially throughout their terms, depending on the fluctuation of market prices.
7.1.2 Mitigation of credit risk, collateralized credit risk and other credit enhancements
In most cases, maximum credit risk exposure is reduced by collateral, credit enhancements and other actions which mitigate the Group’s exposure. The BBVA Group applies a credit risk hedging and mitigation policy deriving from a banking approach focused on relationship banking. The existence of guarantees could be a necessary but not sufficient instrument for accepting risks, as the assumption of risks by the Group requires prior evaluation of the debtor’s capacity for repayment, or that the debtor can generate sufficient resources to allow the amortization of the risk incurred under the agreed terms.
The policy of accepting risks is therefore organized into three different levels in the BBVA Group:
- Analysis of the financial risk of the operation, based on the debtor’s capacity for repayment or generation of funds;
- The constitution of guarantees that are adequate, or at any rate generally accepted, for the risk assumed, in any of the generally accepted forms: monetary, secured, personal or hedge guarantees; and finally,
- Assessment of the repayment risk (asset liquidity) of the guarantees received.
The procedures for the management and valuation of collaterals are set out in the Internal Manuals on Credit Risk Management Policies and Procedures (retail and wholesale), which establish the basic principles for credit risk management, including the management of collaterals assigned in transactions with customers.
The methods used to value the collateral are in line with the best market practices and imply the use of appraisal of real-estate collateral, the market price in market securities, the trading price of shares in mutual funds, etc. All the collaterals assigned must be properly drawn up and entered in the corresponding register. They must also have the approval of the Group’s legal units.
The following is a description of the main types of collateral for each financial instrument class:
- Financial instruments held for trading: The guarantees or credit enhancements obtained directly from the issuer or counterparty are implicit in the clauses of the instrument.
- Trading and hedging derivatives: In derivatives, credit risk is minimized through contractual netting agreements, where positive- and negative-value derivatives with the same counterparty are offset for their net balance. There may likewise be other kinds of guarantees, depending on counterparty solvency and the nature of the transaction.
The Group uses credit derivatives to mitigate credit risk in its loan portfolio and other cash positions and to hedge risks assumed in market transactions with other clients and counterparties. Credit risk originating from the derivatives in which the Group operates is mitigated through the contractual rights existing for offsetting accounts at the time of their settlement. This has reduced the Group’s exposure to credit risk to €25,475 million as of December 31, 2013, €32,586 million as of December 31, 2012 and €34,770 million as of December 31, 2011.
Derivatives may follow different settlement and netting agreements, under the rules of the International Swaps and Derivatives Association (ISDA). The most common types of settlement triggers include bankruptcy of the reference credit institution, acceleration of indebtedness, failure to pay, restructuring, repudiation and dissolution of the entity. Since the Group typically confirms over 99% of the credit derivative transactions in the Depository Trust & Clearing Corporation (DTCC), substantially the entire credit derivatives portfolio is registered and matched against BBVA’s counterparties.
- Other financial assets designated at fair value through profit or loss and Available-for-sale financial assets: The guarantees or credit enhancements obtained directly from the issuer or counterparty are inherent to the structure of the instrument.
- Loans and receivables:
- Loans and advances to credit institutions: These usually only have the counterparty’s personal guarantee.
- Loans and advances to customers: Most of these operations are backed by personal guarantees extended by the counterparty. There may also be collateral to secure loans and advances to customers (such as mortgages, cash guarantees, pledged securities and other collateral), or to obtain other credit enhancements (bonds, hedging, etc.).
- Debt securities: The guarantees or credit enhancements obtained directly from the issuer or counterparty are inherent to the structure of the instrument.
Collateralized loans granted by the Group as of December 31, 2013, 2012 and 2011, excluding balances deemed impaired, is broken down in the table below:
Download Excel
| Collateralized Credit Risk | Millions of Euros | ||
|---|---|---|---|
| 2013 | 2012 | 2011 | |
| Mortgage loans | 125,564 | 137,870 | 129,536 |
| Operating assets mortgage loans | 3,778 | 3,897 | 3,574 |
| Home mortgages | 108,745 | 119,235 | 108,190 |
| Rest of mortgages (1) | 13,041 | 14,739 | 17,772 |
| Secured loans, except mortgage | 23,660 | 23,125 | 23,915 |
| Cash guarantees | 300 | 377 | 286 |
| Secured loan (pledged securities) | 570 | 997 | 589 |
| Rest of secured loans (2) | 22,790 | 21,751 | 23,041 |
| Total | 149,224 | 160,995 | 153,451 |
- Financial guarantees, other contingent risks and drawable by third parties: These have the counterparty’s personal guarantee.
7.1.3 Policies for preventing excessive risk concentration
In order to prevent the build-up of excessive concentrations of credit risk at the individual, country and sector levels, the BBVA Group maintains maximum permitted risk concentration indices updated at individual and portfolio sector levels tied to the various observable variables within the field of credit risk management. The limit on the Group’s exposure or financial commitment to a specific customer therefore depends on the customer’s credit rating, the nature of the risks involved, and the Group’s presence in a given market, based on the following guidelines:
- The aim is, as far as possible, to combine the customer’s credit needs (commercial/financial, short-term/long-term, etc.) with the interests of the Group.
- Any legal limits that may exist concerning risk concentration are taken into account (relationship between risks with a customer and the capital of the entity that assumes them), the markets, the macroeconomic situation, etc.
- To properly management risk exposures of transactions over 2.5% of the Group’s Net Equity any transactions over this threshold will be authorized by the Risk Committee of the Bank’s Board of Directors.
Risk concentrations by geography
Below is a breakdown of the balances of financial instruments registered in the accompanying consolidated balance sheets by their concentration in geographical areas and according to the residence of the customer or counterparty. It does not take into account valuation adjustments, impairment losses or loan-loss provisions:
Download Excel
| Risks by Geographical Areas 2013 |
Millions of Euros | ||||||
|---|---|---|---|---|---|---|---|
| Spain | Europe, Excluding Spain |
Mexico | USA | South America |
Other | Total | |
| Financial assets - |
|
|
|
|
|
|
|
| Financial assets held for trading | 14,882 | 33,091 | 15,707 | 2,677 | 3,412 | 2,345 | 72,114 |
| Loans and advances to customers | - | - | - | 107 | - | - | 107 |
| Debt securities | 6,320 | 5,838 | 13,410 | 424 | 2,608 | 1,002 | 29,602 |
| Equity instruments | 2,752 | 953 | 632 | 118 | 148 | 163 | 4,766 |
| Derivatives | 5,810 | 26,300 | 1,665 | 2,028 | 656 | 1,180 | 37,639 |
| Other financial assets designated at fair value through profit or loss |
211 | 106 | 1,591 | 503 | 2 | - | 2,413 |
| Loans and advances to credit institutions | - | - | - | - | - | - | - |
| Debt securities | 107 | 54 | 5 | 497 | - | - | 663 |
| Equity instruments | 104 | 52 | 1,586 | 6 | 2 | - | 1,750 |
| Available-for-sale portfolio | 42,074 | 8,587 | 10,380 | 7,729 | 5,626 | 3,011 | 77,407 |
| Debt securities | 38,732 | 8,453 | 10,329 | 7,247 | 5,535 | 1,143 | 71,439 |
| Equity instruments | 3,342 | 134 | 51 | 482 | 91 | 1,868 | 5,968 |
| Loans and receivables | 194,383 | 26,712 | 44,414 | 39,650 | 53,886 | 4,984 | 364,031 |
| Loans and advances to credit institutions | 5,224 | 9,171 | 2,366 | 2,707 | 1,909 | 1,415 | 22,792 |
| Loans and advances to customers | 187,400 | 17,519 | 42,048 | 36,047 | 50,173 | 3,569 | 336,759 |
| Debt securities | 1,759 | 22 | - | 896 | 1,804 | - | 4,481 |
| Held-to-maturity investments | - | - | - | - | - | - | - |
| Hedging derivatives | 434 | 2,113 | 8 | 60 | 10 | 4 | 2,629 |
| Total Risk in Financial Assets | 251,984 | 70,609 | 72,100 | 50,618 | 62,935 | 10,344 | 518,591 |
| Contingent risks and liabilities |
|
|
|
|
|
|
|
| Contingent risks | 15,172 | 9,038 | 767 | 2,344 | 5,292 | 929 | 33,542 |
| Contingent liabilities | 28,096 | 17,675 | 16,109 | 24,485 | 7,002 | 803 | 94,170 |
| Total Contingent Risk | 43,268 | 26,713 | 16,876 | 26,829 | 12,294 | 1,732 | 127,712 |
| Total Risks in Financial Instruments | 295,252 | 97,322 | 88,976 | 77,447 | 75,229 | 12,076 | 646,303 |
Download Excel
| Risks by Geographical Areas 2012 |
Millions of Euros | ||||||
|---|---|---|---|---|---|---|---|
| Spain | Europe Excluding Spain |
Mexico | USA | South America |
Other | Total | |
| Financial assets - |
|
|
|
|
|
|
|
| Financial assets held for trading | 13,768 | 39,360 | 15,035 | 4,751 | 3,643 | 3,272 | 79,830 |
| Loans and advances to customers | - | - | - | 244 | - | - | 244 |
| Debt securities | 5,726 | 5,155 | 12,960 | 577 | 2,805 | 796 | 28,020 |
| Equity instruments | 1,270 | 519 | 101 | 543 | 239 | 243 | 2,915 |
| Derivatives | 6,772 | 33,686 | 1,973 | 3,387 | 599 | 2,233 | 48,651 |
| Other financial assets designated at fair value through profit or loss |
296 | 87 | 13 | 2,134 | - | - | 2,531 |
| Loans and advances to credit institutions | - | - | - | - | - | - | - |
| Debt securities | 190 | 42 | 9 | 512 | - | - | 753 |
| Equity instruments | 106 | 45 | 4 | 1,622 | - | - | 1,777 |
| Available-for-sale portfolio | 36,109 | 6,480 | 9,601 | 7,163 | 6,128 | 1,085 | 66,567 |
| Debt securities | 33,107 | 6,267 | 9,035 | 7,112 | 6,053 | 1,040 | 62,615 |
| Equity instruments | 3,002 | 213 | 566 | 51 | 75 | 45 | 3,952 |
| Loans and receivables | 209,786 | 31,375 | 46,384 | 40,259 | 51,978 | 4,314 | 384,096 |
| Loans and advances to credit institutions | 3,220 | 11,042 | 4,549 | 3,338 | 2,065 | 1,157 | 25,372 |
| Loans and advances to customers | 205,216 | 19,979 | 41,835 | 36,040 | 48,753 | 3,151 | 354,973 |
| Debt securities | 1,350 | 354 | - | 880 | 1,160 | 6 | 3,751 |
| Held-to-maturity investments | 7,279 | 2,884 | - | - | - | - | 10,162 |
| Hedging derivatives | 914 | 3,798 | 159 | 226 | 5 | 18 | 5,120 |
| Total Risk in Financial Assets | 268,151 | 83,984 | 71,192 | 54,532 | 61,754 | 8,691 | 548,305 |
| Contingent risks and liabilities |
|
|
|
|
|
|
|
| Contingent risks | 16,164 | 10,074 | 872 | 3,159 | 5,858 | 891 | 37,019 |
| Contingent liabilities | 26,514 | 19,678 | 13,564 | 22,027 | 7,097 | 1,264 | 90,142 |
| Total Contingent Risk | 42,678 | 29,752 | 14,435 | 25,186 | 12,955 | 2,155 | 127,161 |
| Total Risks in Financial Instruments | 310,829 | 113,736 | 85,627 | 79,718 | 74,709 | 10,846 | 675,466 |
Download Excel
| Risks by Geographical Areas 2011 |
Millions of Euros | ||||||
|---|---|---|---|---|---|---|---|
| Spain | Europe, Excluding Spain |
Mexico | USA | South America |
Other | Total | |
| Financial assets - |
|
|
|
|
|
|
|
| Financial assets held for trading | 12,955 | 33,187 | 11,676 | 4,664 | 5,452 | 2,538 | 70,472 |
| Debt securities | 5,075 | 2,039 | 10,933 | 565 | 2,030 | 304 | 20,946 |
| Equity instruments | 662 | 357 | 741 | 69 | 125 | 238 | 2,192 |
| Derivatives | 7,218 | 30,791 | 2 | 4,030 | 3,297 | 1,996 | 47,334 |
| Other financial assets designated at fair value through profit or loss |
234 | 107 | 1,470 | 509 | 454 | - | 2,774 |
| Debt securities | 117 | 77 | 6 | 508 | 1 | - | 709 |
| Equity instruments | 117 | 30 | 1,464 | 1 | 453 | - | 2,065 |
| Available-for-sale portfolio | 26,546 | 5,390 | 7,825 | 8,151 | 5,164 | 654 | 53,730 |
| Debt securities | 22,371 | 5,184 | 7,764 | 7,518 | 5,068 | 601 | 48,506 |
| Equity instruments | 4,175 | 206 | 61 | 633 | 96 | 53 | 5,224 |
| Loans and receivables | 207,858 | 32,598 | 42,489 | 42,646 | 44,535 | 7,397 | 377,523 |
| Loans and advances to credit institutions | 3,034 | 10,079 | 4,877 | 2,570 | 2,195 | 1,647 | 24,402 |
| Loans and advances to customers | 203,459 | 22,392 | 37,612 | 39,384 | 41,650 | 5,744 | 350,241 |
| Debt securities | 1,365 | 127 | - | 692 | 690 | 6 | 2,880 |
| Held-to-maturity investments | 7,374 | 3,582 | - | - | - | - | 10,956 |
| Debt securities | 395 | 3,489 | 485 | 244 | 16 | 56 | 4,685 |
| Total Risk in Financial Assets | 255,362 | 78,353 | 63,945 | 56,214 | 55,621 | 10,645 | 520,140 |
| Contingent risks and liabilities |
|
|
|
|
|
|
|
| Contingent risks | 16,149 | 10,169 | 1,098 | 3,986 | 4,733 | 1,494 | 37,629 |
| Contingent liabilities | 30,848 | 18,429 | 11,929 | 22,002 | 6,192 | 1,288 | 90,688 |
| Total Contingent Risk | 46,997 | 28,598 | 13,027 | 25,988 | 10,925 | 2,782 | 128,317 |
| Total Risks in Financial Instruments | 302,359 | 106,951 | 76,972 | 82,202 | 66,546 | 13,427 | 648,457 |
The breakdown of the main figures in the most significant foreign currencies in the accompanying consolidated balance sheets is set forth in Appendix VII.
Sovereign risk concentration
Sovereign risk management
The risk associated with the transactions involving sovereign risk is identified, measured, controlled and tracked by a centralized unit integrated in the BBVA Group’s Risk Area. Its basic functions involve the preparation of reports in the countries where sovereign risk exists (called “financial programs”), tracking such risks, assigning ratings to these countries and, in general, supporting the Group in terms of reporting requirements for any transactions involving sovereign risk. The risk policies established in the financial programs are approved by the relevant risk committees.
The country risk unit tracks the evolution of the risks associated with the various countries to which the Group are exposed (including sovereign risk) on an ongoing basis in order to adapt its risk and mitigation policies to any macroeconomic and political changes that may occur. Moreover, it regularly updates its internal ratings and forecasts for these countries. The internal rating assignment methodology is based on the assessment of quantitative and qualitative parameters which are in line with those used by certain multilateral organizations such as the International Monetary Fund (IMF) and the World Bank (WB), rating agencies and export credit organizations.
Sovereign risk exposure
The table below provides a breakdown of exposure to financial instruments, as of December 31, 2013, 2012 and 2011, by type of counterparty and the country of residence of such counterparty. The below figures do not take into account valuation adjustments, impairment losses or loan-loss provisions:
Download Excel
| Risk Exposure by countries | Millions of Euros | ||||
|---|---|---|---|---|---|
| 2013 | |||||
| Sovereign Risk (*) |
Financial Institutions | Other Sectors | Total | % | |
| Spain | 59,114 | 11,870 | 166,677 | 237,661 | 51.1% |
| United Kingdom | 3 | 5,405 | 4,377 | 9,785 | 2.1% |
| Italy | 3,888 | 422 | 2,617 | 6,927 | 1.5% |
| France | 942 | 2,640 | 2,316 | 5,898 | 1.3% |
| Portugal | 385 | 238 | 5,179 | 5,802 | 1.2% |
| Germany | 1,081 | 1,338 | 1,206 | 3,625 | 0.8% |
| Ireland | - | 221 | 487 | 708 | 0.2% |
| Turkey | 10 | 65 | 163 | 238 | 0.1% |
| Greece | - | - | 72 | 72 | 0.0% |
| Rest of Europe | 2,608 | 2,552 | 4,239 | 9,399 | 2.0% |
| Europe | 68,031 | 24,751 | 187,333 | 280,115 | 60.2% |
| Mexico | 26,629 | 2,810 | 38,312 | 67,751 | 14.6% |
| The United States | 5,224 | 3,203 | 41,872 | 50,299 | 10.8% |
| Rest of countries | 7,790 | 5,480 | 53,649 | 66,919 | 14.4% |
| Total Rest of Countries | 39,643 | 11,493 | 133,833 | 184,969 | 39.8% |
| Total Exposure to Financial Instruments | 107,674 | 36,244 | 321,166 | 465,084 | 100.0% |
Download Excel
| Risk Exposure by countries | Millions of Euros | ||||
|---|---|---|---|---|---|
| 2012 | |||||
| Sovereign Risk (*) |
Financial Institutions | Other Sectors | Total | % | |
| Spain | 62,558 | 11,839 | 182,785 | 257,182 | 52.9% |
| United Kingdom | 13 | 159 | 400 | 572 | 0.1% |
| Italy | 2 | 7,095 | 2,336 | 9,433 | 1.9% |
| France | 4,203 | 405 | 3,288 | 7,896 | 1.6% |
| Portugal | 443 | 590 | 5,763 | 6,796 | 1.4% |
| Germany | 1,739 | 3,291 | 2,631 | 7,661 | 1.6% |
| Ireland | 1,298 | 1,025 | 734 | 3,057 | 0.6% |
| Turkey | - | 280 | 456 | 736 | 0.2% |
| Greece | - | - | 99 | 99 | 0.0% |
| Rest of Europe | 1,664 | 2,484 | 5,256 | 9,404 | 1.9% |
| Europe | 71,920 | 27,168 | 203,748 | 302,836 | 62.3% |
| Mexico | 25,059 | 5,492 | 36,133 | 66,684 | 13.7% |
| The United States | 3,942 | 3,768 | 42,157 | 49,867 | 10.3% |
| Rest of countries | 7,521 | 5,484 | 53,481 | 66,486 | 13.7% |
| Total Rest of Countries | 36,523 | 14,744 | 131,771 | 183,037 | 37.7% |
| Total Exposure to Financial Instruments | 108,443 | 41,912 | 335,519 | 485,873 | 100.0% |
Download Excel
|
|
Millions of Euros | ||||
|---|---|---|---|---|---|
|
|
2011 | ||||
| Risk Exposure by countries | Sovereign Risk (*) |
Financial Institutions | Other Sectors | Total | % |
| Spain | 56,473 | 6,883 | 178,065 | 241,420 | 52.7% |
| United Kingdom | 120 | 6,547 | 3,498 | 10,164 | 2.2% |
| Italy | 4,301 | 487 | 4,704 | 9,493 | 2.1% |
| France | 279 | 829 | 6,715 | 7,824 | 1.7% |
| Portugal | 619 | 1,653 | 3,038 | 5,310 | 1.2% |
| Germany | 582 | 902 | 908 | 2,392 | 0.5% |
| Ireland | 0 | 182 | 212 | 394 | 0.1% |
| Turkey | 17 | 42 | 291 | 350 | 0.1% |
| Greece | 109 | 0 | 32 | 141 | 0.0% |
| Rest of Europe | 647 | 4,319 | 5,549 | 10,515 | 2.3% |
| Europe | 63,147 | 21,844 | 203,011 | 288,002 | 62.8% |
| Mexico | 22,875 | 5,508 | 31,110 | 59,493 | 13.0% |
| The United States | 3,501 | 3,254 | 42,550 | 49,305 | 10.8% |
| Rest of countries | 7,281 | 3,800 | 50,386 | 61,467 | 13.4% |
| Total Rest of Countries | 33,657 | 12,562 | 124,046 | 170,266 | 37.2% |
| Total Exposure to Financial Instruments | 96,805 | 34,405 | 327,058 | 458,268 | 100.0% |
The exposure to sovereign risk set out in the above table includes positions held in government debt securities in countries where the Group operates. They are used for ALCO’s management of the interest-rate risk on the balance sheets of the Group’s entities in these countries, as well as for hedging of pension and insurance commitments by insurance entities within the BBVA Group.
Sovereign risk exposure in Europe
In December 2013, sovereign risk exposure in Europe data was published by Group’s credit entities as of June 30, 2013 and December 31, 2012. This publication was made under the European Banking Authority (hereinafter "EBA" acronym for "European Banking Authority") scheme.
The table below provides a breakdown of the exposure of the Group’s credit institutions to European sovereign risk as of December 31, 2013, 2012 and 2011, by type of financial instrument and the country of residence of the counterparty, under EBA requirements:
Download Excel
| Exposure to Sovereign Risk by European Union Countries (1) | Millions of Euros | ||||||||
|---|---|---|---|---|---|---|---|---|---|
| 2013 | |||||||||
| Debt securities | Loans and Receivables | Derivatives (2) | Total (2) |
Contingent risks and commitments | % | ||||
| Financial Assets Held-for-Trading | Available-for-Sale Financial Assets | Held-to-Maturity Investments | Direct Exposure | Indirect Exposure | |||||
| Spain | 5,251 | 24,339 | - | 23,430 | 258 | (25) | 53,253 | 1,924 | 82.8% |
| Italy | 733 | 2,691 | - | 90 | - | (6) | 3,508 | - | 5.5% |
| France | 874 | - | - | - | - | (1) | 873 | - | 1.4% |
| Germany | 1,064 | - | - | - | - | (1) | 1,063 | - | 1.7% |
| Portugal | 64 | 19 | - | 302 | - | - | 385 | 17 | 0.6% |
| United Kingdom | - | - | - | - | (13) | 3 | (10) | 1 | - |
| Greece | - | - | - | - | - | - | - | - | - |
| Hungary | - | 65 | - | - | - | - | 65 | - | 0.1% |
| Ireland | - | - | - | - | - | - | - | - | - |
| Rest of European Union | 2,100 | 3,038 | - | 38 | - | 10 | 5,186 | - | 8.1% |
| Total Exposure to Sovereign Counterparties (European Union) | 10,086 | 30,152 | - | 23,860 | 245 | (20) | 64,323 | 1,942 | 100.0% |
Download Excel
| Exposure to Sovereign Risk by European Union Countries (1) | Millions of Euros | ||||||||
|---|---|---|---|---|---|---|---|---|---|
| 2012 | |||||||||
| Debt securities | Loans and Receivables | Derivatives (2) | Total (2) |
Contingent risks and commitments | % | ||||
| Financial Assets Held-for-Trading | Available-for-Sale Financial Assets | Held-to-Maturity Investments | Direct Exposure | Indirect Exposure | |||||
| Spain | 5,022 | 19,751 | 6,469 | 26,624 | 285 | 5 | 58,156 | 1,595 | 86.6% |
| Italy | 610 | 811 | 2,448 | 97 | - | (3) | 3,963 | - | 5.9% |
| France | 1,445 | - | 254 | - | - | (2) | 1,697 | - | 2.5% |
| Germany | 1,291 | - | - | - | (4) | (1) | 1,286 | - | 1.9% |
| Portugal | 51 | 18 | 15 | 359 | - | - | 443 | 17 | 0.7% |
| United Kingdom | - | - | - | - | (19) | - | (19) | 1 | - |
| Greece | - | - | - | - | - | - | - | - | - |
| Hungary | - | 66 | - | - | - | - | 66 | - | 0.1% |
| Ireland | - | - | - | - | - | - | - | - | - |
| Rest of European Union | 1,066 | 379 | 24 | 78 | - | 1 | 1,548 | - | 2.3% |
| Total Exposure to Sovereign Counterparties (European Union) | 9,485 | 21,025 | 9,210 | 27,158 | 262 | - | 67,140 | 1,613 | 100.0% |
Download Excel
| Exposure to Sovereign Risk by European Union Countries (1) | Millions of Euros | ||||||||
|---|---|---|---|---|---|---|---|---|---|
| 2011 | |||||||||
| Debt securities | Loans and Receivables | Derivatives (2) | Total (2) |
Contingent risks and commitments | % | ||||
| Financial Assets Held-for-Trading | Available-for-Sale Financial Assets | Held-to-Maturity Investments | Direct Exposure | Indirect Exposure | |||||
| Spain | 4,366 | 15,225 | 6,520 | 26,637 | 96 | - | 52,844 | 3,455 | 89.1% |
| Italy | 350 | 634 | 2,956 | 184 | - | (23) | 4,101 | - | 6.9% |
| France | 513 | 6 | 69 | - | (3) | (2) | 583 | - | 1.0% |
| Germany | 338 | 12 | 254 | - | - | (3) | 601 | - | 1.0% |
| Portugal | 39 | 11 | 13 | 216 | - | (1) | 278 | 65 | 0.5% |
| United Kingdom | - | 120 | - | - | (3) | - | 117 | 1 | 0.2% |
| Greece | - | 10 | 84 | 15 | - | (8) | 101 | - | 0.2% |
| Hungary | - | 53 | - | - | - | - | 53 | - | 0.1% |
| Ireland | - | 7 | - | - | - | 1 | 8 | - | 0.0% |
| Rest of European Union | 155 | 351 | - | 130 | - | 2 | 638 | 4 | 1.1% |
| Total Exposure to Sovereign Counterparties (European Union) | 5,761 | 16,429 | 9,896 | 27,182 | 89 | (34) | 59,323 | 3,525 | 100.0% |
The following table provides a breakdown of the notional value of the CDS in which the Group’s credit institutions act as sellers or buyers of protection against the sovereign risk of European countries:
Download Excel
| Exposure to Sovereign Risk by European Countries | Millions of Euros | |||
|---|---|---|---|---|
| 2013 | ||||
| Credit derivatives (CDS) and other contracts in which the Group act as a protection seller | Credit derivatives (CDS) and other contracts in which the Group act as a protection buyer | |||
| Notional value | Fair value | Notional value | Fair value | |
| Spain | 14 | - | 62 | (25) |
| Italy | 622 | (15) | 595 | 9 |
| Germany | 205 | - | 200 | (1) |
| France | 204 | - | 149 | (1) |
| Portugal | 75 | (3) | 75 | 3 |
| Poland | - | - | - | - |
| Belgium | - | - | - | - |
| United Kingdom | 135 | 3 | 126 | - |
| Greece | 14 | - | 14 | - |
| Hungary | 1 | - | - | - |
| Ireland | 21 | - | 21 | - |
| Rest of European Union | 591 | 12 | 478 | (2) |
| Total exposure to Sovereign Counterparties | 1,882 | (3) | 1,720 | (17) |
Download Excel
| Exposure to Sovereign Risk by European Countries | Millions of Euros | |||
|---|---|---|---|---|
| 2012 | ||||
| Credit derivatives (CDS) and other contracts in which the Group act as a protection seller | Credit derivatives (CDS) and other contracts in which the Group act as a protection buyer | |||
| Notional value | Fair value | Notional value | Fair value | |
| Spain | 68 | 14 | 97 | (9) |
| Italy | 518 | (22) | 444 | 19 |
| Germany | 216 | (1) | 219 | - |
| France | 196 | (1) | 134 | (1) |
| Portugal | 91 | (6) | 89 | 6 |
| Poland | - | - | - | - |
| Belgium | 281 | (4) | 232 | 5 |
| United Kingdom | 56 | 1 | 64 | (1) |
| Greece | 18 | - | 18 | - |
| Hungary | 2 | - | - | - |
| Ireland | 82 | - | 82 | - |
| Rest of European Union | 149 | 2 | 155 | (2) |
| Total exposure to Sovereign Counterparties | 1,677 | (17) | 1,534 | 17 |
Download Excel
| Exposure to Sovereign Risk by European Countries | Millions of Euros | |||
|---|---|---|---|---|
| 2011 | ||||
| Credit derivatives (CDS) and other contracts in which the Group act as a protection seller | Credit derivatives (CDS) and other contracts in which the Group act as a protection buyer | |||
| Notional value | Fair value | Notional value | Fair value | |
| Spain | 20 | 2 | 20 | (2) |
| Italy | 283 | 38 | 465 | (61) |
| Germany | 182 | 4 | 184 | (6) |
| France | 102 | 3 | 123 | (6) |
| Portugal | 85 | 21 | 93 | (22) |
| Poland | - | - | - | - |
| Belgium | - | - | - | - |
| United Kingdom | 20 | 2 | 20 | (2) |
| Greece | 53 | 25 | 66 | (33) |
| Hungary | - | - | 2 | - |
| Ireland | 82 | 10 | 82 | (9) |
| Rest of European Union | 294 | 31 | 329 | (29) |
| Total exposure to Sovereign Counterparties | 1,119 | 136 | 1,382 | (170) |
The main counterparties of these CDS are credit institutions with a high credit quality. The CDS contracts are standard in the market, with the usual clauses covering the events that would trigger payouts.
As it can be seen in the above tables, exposure to sovereign risk in Europe is concentrated in Spain. As of December 31, 2013, 2012 and 2011, the breakdown of total exposure faced by the Group’s credit institutions to Spain and other countries, by maturity of the financial instruments, is as follows:
Download Excel
| Maturities of sovereign risks European Union | Millions of Euros | |||||||
|---|---|---|---|---|---|---|---|---|
| 2013 | ||||||||
| Debt securities | Loans and Receivables | Derivatives | Total (*) | % | ||||
| Financial Assets Held-for-Trading | Available-for-Sale Financial Assets | Held-to-Maturity Investments | Direct Exposure | Indirect Exposure | ||||
| Spain |
|
|
|
|
|
|
|
|
| Up to 1 Year | 1,935 | 846 | - | 5,627 | 8 | - | 8,416 | 13.1% |
| 1 to 5 Years | 1,531 | 15,523 | - | 5,574 | 41 | - | 22,669 | 35.2% |
| Over 5 Years | 1,784 | 7,969 | - | 12,229 | 209 | (25) | 22,166 | 34.5% |
| Rest of Europe |
|
|
|
|
|
|
|
|
| Up to 1 Year | 3,198 | 645 | - | 311 | (13) | - | 4,141 | 6.4% |
| 1 to 5 Years | 847 | 3,016 | - | 8 | - | 4 | 3,875 | 6.0% |
| Over 5 Years | 791 | 2,153 | - | 111 | - | 1 | 3,056 | 4.8% |
| Total Exposure to European Union Sovereign Counterparties | 10,086 | 30,152 | - | 23,860 | 245 | (20) | 64,323 | 100.0% |
Download Excel
| Maturities of sovereign risks European Union | Millions of Euros | |||||||
|---|---|---|---|---|---|---|---|---|
| 2012 | ||||||||
| Debt securities | Loans and Receivables | Derivatives | Total (*) | % | ||||
| Financial Assets Held-for-Trading | Available-for-Sale Financial Assets | Held-to-Maturity Investments | Direct Exposure | Indirect Exposure | ||||
| Spain |
|
|
|
|
|
|
|
|
| Up to 1 Year | 2,183 | 1,944 | 2 | 10,267 | 35 | - | 14,431 | 21.5% |
| 1 to 5 Years | 1,832 | 12,304 | 1,239 | 4,409 | 26 | - | 19,810 | 29.5% |
| Over 5 Years | 1,007 | 5,503 | 5,228 | 11,948 | 224 | 5 | 23,915 | 35.6% |
| Rest of Europe |
|
|
|
|
|
|
|
|
| Up to 1 Year | 2,564 | 46 | 33 | 367 | 7 | - | 3,019 | 4.5% |
| 1 to 5 Years | 952 | 190 | 1,927 | 34 | (19) | (5) | 3,079 | 4.6% |
| Over 5 Years | 947 | 1,038 | 781 | 131 | (11) | - | 2,886 | 4.3% |
| Total Exposure to European Union Sovereign Counterparties | 9,485 | 21,025 | 9,210 | 27,158 | 262 | - | 67,140 | 100.0% |
Download Excel
| Maturities of sovereign risks European Union | Millions of Euros | |||||||
|---|---|---|---|---|---|---|---|---|
| 2011 | ||||||||
| Debt securities | Loans and Receivables | Derivatives | Total (*) | % | ||||
| Financial Assets Held-for-Trading | Available-for-Sale Financial Assets | Held-to-Maturity Investments | Direct Exposure | Indirect Exposure | ||||
| Spain |
|
|
|
|
|
|
|
|
| Up to 1 Year | 2,737 | 779 | 36 | 9,168 | 1 | - | 12,721 | 21.4% |
| 1 to 5 Years | 1,025 | 11,630 | 1,078 | 4,265 | 67 | - | 18,065 | 30.5% |
| Over 5 Years | 604 | 2,816 | 5,406 | 13,204 | 27 | - | 22,057 | 37.2% |
| Rest of Europe |
|
|
|
|
|
|
|
|
| Up to 1 Year | 684 | 219 | 72 | 370 | 3 | (1) | 1,347 | 2.3% |
| 1 to 5 Years | 297 | 267 | 2,439 | 38 | (1) | (17) | 3,023 | 5.1% |
| Over 5 Years | 414 | 718 | 865 | 137 | (8) | (15) | 2,111 | 3.6% |
| Total Exposure to European Union Sovereign Counterparties | 5,761 | 16,429 | 9,896 | 27,182 | 89 | (33) | 59,324 | 100.0% |
Valuation and impairment methods
The valuation methods used to assess the instruments that are subject to sovereign risks are the same ones used for other instruments included in the relevant portfolios and are detailed in Note 8 to these consolidated financial statements. They take into account the exceptional circumstances that have taken place over the last two years in connection with the sovereign debt crisis in Europe.
Specifically, the fair value of sovereign debt securities of European countries has been considered equivalent to their listed price in active markets (Level 1 as defined in Note 8).
Risks related to the developer and real-estate sector in Spain
One of the main Group activities of the Group in Spain is focused on developer and mortgage loans. The policies and strategies established by the Group to deal with risks related to the developer and real-estate sector are explained below:
Policies and strategies established by the Group to deal with risks related to the developer and real-estate sector
BBVA has teams specializing in the management of the Real-Estate Sector risk, given its economic importance and specific technical component. This specialization is not only in the Risk-Acceptance teams, but throughout the handling, commercial, problem risks and legal, etc. It also includes the research department (BBVA Research), which helps determine the medium/long-term vision needed to manage this portfolio. Specialization has been increased and the management teams in the areas of recovery and the Real Estate Unit itself have been reinforced.
The policies established to address the risks related to the developer and real-estate sector, aim to accomplish, among others, the following objectives: to avoid concentration in terms of customers, products and regions; to estimate the risk profile for the portfolio; and to anticipate possible worsening of the portfolio.
Specific policies for analysis and admission of new developer risk transactions
In the analysis of new operations, the assessment of the commercial operation in terms of the economic and financial viability of the project has been one of the constant points that have helped ensure the success and transformation of construction land operations for customers’ developments.
As regards the participation of the Risk Acceptance teams, they have a direct link and participate in the committees of areas such as Recoveries and the Real Estate Unit. This guarantees coordination and exchange of information in all the processes.
The following strategies have been implemented with customers in the developer sector: avoidance of large corporate transactions, which had already reduced their share in the years of greatest market growth; non active participation in the second-home market; commitment to public housing financing; and participation in land operations with a high level of urban development security, giving priority to land open to urban development.
Risk monitoring policies
The base information for analyzing the real estate portfolios is updated monthly. The tools used include the so-called “watch-list”, which is updated monthly with the progress of each client under watch, and the different strategic plans for management of special groups. There are plans that involve an intensification of the review of the portfolio for financing land, while, in the case of ongoing promotions, they are classified based on the rate of progress of the projects.
These actions have enabled BBVA to identify possible impairment situations, by always keeping an eye on BBVA’s position with each customer (whether or not as first creditor). In this regard, key aspects include management of the risk policy to be followed with each customer, contract review, deadline extension, improved collateral, rate review (repricing) and asset purchase.
Proper management of the relationship with each customer requires knowledge of various aspects such as the identification of the source of payment difficulties, an analysis of the company’s future viability, the updating of the information on the debtor and the guarantors (their current situation and business course, economic-financial information, debt analysis and generation of funds), and the updating of the appraisal of the assets offered as collateral.
BBVA has a classification of debtors in accordance with legislation in force in each country, usually categorizing each one’s level of difficulty for each risk.
Based on the information above, a decision is made whether to use the refinancing tool, whose objective is to adjust the structure of the maturity of the debt to the generation of funds and the customer’s payment capacity.
As for the policies relating to risk refinancing with the developer and real-estate sector, they are the same as the general policies used for all of the Group’s risks (see Note7.1.8). In the developer and real estate sector, they are based on clear solvency and viability criteria for projects, with demanding terms for additional guarantees and legal compliance, given a refinancing tool that standardizes criteria and variables when considering any refinancing operation.
In the case of refinancing, the tools used for enhancing the Bank’s position are: the search for new intervening parties with proven solvency and initial payment to reduce the principal debt or outstanding interest; the improvement of the debt bond in order to facilitate the procedure in the event of default; the provision of new or additional collateral; and making refinancing viable with new conditions (period, rate and repayments), adapted to a credible and sufficiently verified business plan.
Policies applied in the management of real estate assets in Spain
The policy applied for managing these assets depends on the type of real-estate asset, as detailed below.
In the case of completed homes, the final aim is the sale of these homes to private individuals, thus diluting the risk and beginning a new business cycle. Here, the strategy has been to help subrogation (the default rate in this channel of business is notably lower than in any other channel of residential mortgages) and to support customers’ sales directly, using BBVA’s own channel (BBVA Services and our branches), creating incentives for sale and including sale orders for BBVA. In exceptional case we have even accepted partial haircuts, with the aim of making the sale easier.
In the case of ongoing construction work, the strategy has been to help and promote the completion of the works in order to transfer the investment to completed homes. The whole developer Works in Progress portfolio has been reviewed and classified into different stages with the aim of using different tools to support the strategy. This includes the use of developer accounts-payable financing as a form of payment control, the use of project monitoring supported by the Real Estate Unit itself, and the management of direct suppliers for the works as a complement to the developer’s own management.
With respect to land, the fact that the vast majority of the risk is urban land simplifies the management. Urban management and liquidity control to tackle urban planning costs are also subject to special monitoring.
Quantitative information on activities in the real-estate market in Spain
The following quantitative information on real-estate activities in Spain has been prepared using the reporting models required by Bank of Spain Circular 5/2011, of November 30.
As of December 31, 2013, 2012 and 2011, exposure to the construction sector and real-estate activities in Spain stood at €22,760, €23,656 and €28,287 million, respectively. Of that amount, risk from loans to construction and real-estate development activities accounted for €13,505, €15,358 and€14,158 million, representing 8.8%, 8.7% and 8.1% of loans and advances to customers of the balance of business in Spain (excluding the government and other government agencies) and 2.3%, 2.4% and 2.4% of the total assets of the Consolidated Group.
Lending for real estate development according to the purpose of the loans as of December 31, 2013, 2012 and 2011 is shown below:
Download Excel
| December 2013 Financing allocated to construction and real estate development and its coverage |
Millions of Euros | ||
|---|---|---|---|
| Gross Amount | Drawn Over the Guarantee Value |
Specific coverage | |
| Loans recorded by the Group’s credit institutions (Business in Spain) |
13,505 | 5,723 | 5,237 |
| Of which: Impaired assets | 8,838 | 4,152 | 4,735 |
| Of which: Potential problem assets | 1,445 | 501 | 502 |
| Memorandum item: |
|
|
|
| Write-offs | 692 |
|
|
Download Excel
| December 2012 Financing allocated to construction and real estate development and its coverage |
Millions of Euros | ||
|---|---|---|---|
| Gross Amount | Drawn Over the Guarantee Value |
Specific coverage | |
| Loans recorded by the Group’s credit institutions (Business in Spain) |
15,358 | 6,164 | 5,642 |
| Of which: Impaired assets | 6,814 | 3,193 | 3,123 |
| Of which: Potential problem assets | 2,092 | 911 | 731 |
| Memorandum item: |
|
|
|
| Write-offs | 347 |
|
|
Download Excel
| December 2011 Financing allocated to construction and real estate development and its coverage |
Millions of Euros | ||
|---|---|---|---|
| Gross Amount | Drawn Over the Guarantee Value |
Specific coverage | |
| Loans recorded by the Group’s credit institutions (Business in Spain) |
14,158 | 4,846 | 1,441 |
| Of which: Impaired assets | 3,743 | 1,725 | 1,123 |
| Of which: Potential problem assets | 2,052 | 911 | 318 |
| Memorandum item: |
|
|
|
| Write-offs | 182 |
|
|
Download Excel
| Memorandum item: Consolidated Group Data (carrying amount) |
Millions of Euros | ||
|---|---|---|---|
| December 2013 | December 2012 | December 2011 | |
| Total loans and advances to customers, excluding the Public Sector (Business in Spain) | 152,836 | 176,123 | 174,467 |
| Total consolidated assets (total business) | 582,575 | 621,072 | 582,838 |
| Impairment losses determined collectively (total business) | 2,698 | 3,279 | 3,027 |
The following is a description of the real estate credit risk based on the types of associated guarantees:
Download Excel
| Credit: Gross amount (Business in Spain) | Millions of Euros | ||
|---|---|---|---|
| December 2013 | December 2012 | December 2011 | |
| Without secured loan | 1,303 | 1,441 | 1,105 |
| With secured loan | 12,202 | 13,917 | 13,053 |
| Terminated buildings | 7,270 | 8,167 | 6,930 |
| Homes | 6,468 | 7,148 | 6,431 |
| Other | 802 | 1,019 | 499 |
| Buildings under construction | 1,238 | 1,716 | 2,448 |
| Homes | 1,202 | 1,663 | 2,374 |
| Other | 36 | 53 | 74 |
| Land | 3,694 | 4,034 | 3,675 |
| Urbanized land | 2,120 | 2,449 | 2,404 |
| Rest of land | 1,574 | 1,585 | 1,271 |
| Total | 13,505 | 15,358 | 14,158 |
As of December 31, 2013, 2012 and 2011, 63%, 64.3% and 66% of loans to developers were guaranteed with buildings (90.1%, 89.1% and 94% are homes), and only 27.4%, 26.3% and 26% by land, of which 57.4%, 60.7% and 65% is urbanized, respectively.
The information on the retail mortgage portfolio risk (housing mortgage) as of December 31, 2013, 2012 and 2011, is as follows:
Download Excel
| Housing-acquisition loans to households (Business in Spain) |
Millions of Euros | ||
|---|---|---|---|
| December 2013 | December 2012 | December 2011 | |
| With secured loan (gross amount) | 82,680 | 87,224 | 79,043 |
| of which: Impaired loans | 5,088 | 3,163 | 2,371 |
| Total | 82,680 | 87,224 | 79,043 |
The loan to value (LTV) ratio of the above portfolio is as follows:
Download Excel
| December 2013 LTV Breakdown of secured loans to households for the purchase of a home (Business in Spain) |
Millions of Euros | |||||
|---|---|---|---|---|---|---|
| Total risk over the amount of the last valuation available (Loan To Value-LTV) | ||||||
| Less than or equal to 40% | Over 40% but less than or equal to 60% | Over 60% but less than or equal to 80% | Over 80% but less than or equal to 100% | Over 100% | Total | |
| Gross amount | 14,481 | 22,558 | 31,767 | 8,975 | 4,899 | 82,680 |
| of which: Impaired loans | 262 | 339 | 618 | 1,011 | 2,858 | 5,088 |
Download Excel
| December 2012 LTV Breakdown of secured loans to households for the purchase of a home (Business in Spain) |
Millions of Euros | |||||
|---|---|---|---|---|---|---|
| Total risk over the amount of the last valuation available (Loan To Value-LTV) | ||||||
| Less than or equal to 40% | Over 40% but less than or equal to 60% | Over 60% but less than or equal to 80% | Over 80% but less than or equal to 100% | Over 100% | Total | |
| Gross amount | 14,942 | 22,967 | 35,722 | 11,704 | 1,889 | 87,224 |
| of which: Impaired loans | 312 | 386 | 1,089 | 1,005 | 371 | 3,163 |
Download Excel
| December 2011 LTV Breakdown of secured loans to households for the purchase of a home (Business in Spain) |
Millions of Euros | |||||
|---|---|---|---|---|---|---|
| Less than or equal to 40% | Over 40% but less than or equal to 60% | Over 60% but less than or equal to 80% | Over 80% but less than or equal to 100% | Over 100% | Total | |
| Gross amount | 12, 408 | 19,654 | 32,887 | 12,870 | 1,224 | 79,043 |
| of which: Impaired loans | 276 | 218 | 695 | 922 | 260 | 2,371 |
Outstanding home mortgage loans as of December 31, 2013, 2012 and 2011 had an average LTV of 50%, 51% and 50% respectively.
As of December 31, 2013, the Group also had a balance of €853 million in non-mortgage loans for the purchase of housing (of which €36 million, respectively, were NPA).
The breakdown of foreclosed, acquired, purchased or exchanged assets from debt from loans relating to business in Spain, as well as the holdings and financing to non-consolidated entities holding such assets is as follows:
Download Excel
| Information about assets received in payment of debts (Business in Spain) | Millions of Euros | ||
|---|---|---|---|
| Gross Value |
Provisions | Carrying Amount | |
| Real estate assets from loans to the construction and real estate development sectors in Spain. | 9,173 | 5,088 | 4,085 |
| Terminated buildings | 3,038 | 1,379 | 1,659 |
| Homes | 2,059 | 925 | 1,134 |
| Other | 979 | 454 | 525 |
| Buildings under construction | 845 | 439 | 406 |
| Homes | 819 | 423 | 396 |
| Other | 26 | 16 | 10 |
| Land | 5,290 | 3,270 | 2,020 |
| Urbanized land | 3,517 | 2,198 | 1,319 |
| Rest of land | 1,773 | 1,072 | 701 |
| Real estate assets from mortgage financing for households for the purchase of a home | 2,874 | 1,164 | 1,710 |
| Rest of foreclosed real estate assets | 918 | 411 | 507 |
| Equity instruments, investments and financing to non-consolidated companies holding said assets | 730 | 408 | 322 |
| Total | 13,695 | 7,071 | 6,624 |
Download Excel
| Information about assets received in payment of debts (Business in Spain) | Millions of Euros | ||
|---|---|---|---|
| Gross Value |
Provisions | Carrying Amount | |
| Real estate assets from loans to the construction and real estate development sectors in Spain. | 8,894 | 4,893 | 4,001 |
| Terminated buildings | 3,021 | 1,273 | 1,748 |
| Homes | 2,146 | 877 | 1,269 |
| Other | 875 | 396 | 479 |
| Buildings under construction | 908 | 528 | 380 |
| Homes | 881 | 512 | 369 |
| Other | 27 | 16 | 11 |
| Land | 4,965 | 3,092 | 1,873 |
| Urbanized land | 3,247 | 2,048 | 1,199 |
| Rest of land | 1,718 | 1,044 | 674 |
| Real estate assets from mortgage financing for households for the purchase of a home | 2,512 | 1,020 | 1,492 |
| Rest of foreclosed real estate assets | 653 | 273 | 380 |
| Equity instruments, investments and financing to non-consolidated companies holding said assets | 702 | 383 | 319 |
| Total | 12,761 | 6,569 | 6,192 |
Download Excel
| Information about assets received in payment of debts (Business in Spain) | Millions of Euros | ||
|---|---|---|---|
| Gross Value |
Provisions | Carrying Amount | |
| Real estate assets from loans to the construction and real estate development sectors in Spain. | 5,101 | 1,740 | 3,361 |
| Terminated buildings | 1,709 | 487 | 1,222 |
| Homes | 1,227 | 333 | 894 |
| Other | 482 | 154 | 328 |
| Buildings under construction | 360 | 115 | 245 |
| Homes | 357 | 114 | 243 |
| Other | 3 | 1 | 2 |
| Land | 3,032 | 1,138 | 1,894 |
| Urbanized land | 1,561 | 570 | 991 |
| Rest of land | 1,471 | 568 | 903 |
| Real estate assets from mortgage financing for households for the purchase of a home | 1,509 | 401 | 1,108 |
| Rest of foreclosed real estate assets | 403 | 167 | 236 |
| Equity instruments, investments and financing to non-consolidated companies holding said assets | 701 | 287 | 414 |
| Total | 7,714 | 2,595 | 5,119 |
As of December 31, 2013, 2012 and 2011, the gross book value of the Group’s real-estate assets from corporate financing of real-estate construction and development was €9,173 million, €8,894 million and €5,101 million, respectively, with an average coverage ratio of 55.4%, 55% and 34.1%, respectively.
The gross book value of real-estate assets from mortgage lending to households for home purchase as of December 31, 2013, 2012 and 2011, amounted to €2,874 million, €2,512 million and €1,509 million, respectively, with an average coverage ratio of 40.5%, 40.6% and 26.6% respectively.
As of December 31, 2013, 2012 and 2011, the gross book value of the BBVA Group’s total real-estate assets (business in Spain), including other real-estate assets received as debt payment, was €12,965 million, €12,059 million and €7,013 million, respectively. The coverage ratio was 51.4%, 51.3% and 32.9% respectively.
7.1.4 Credit quality of financial assets that are neither past due nor impaired
The BBVA Group has tools (“scoring” and “rating”) that enable it to rank the credit quality of its operations and customers based on an assessment and its correspondence with the probability of default (“PD”) scales. To analyze the performance of PD, the Group has a series of tracking tools and historical databases that collect the pertinent internally generated information, which can basically be grouped together into scoring and rating models.
Scoring
Scoring is a decision-making model that contributes to both the arrangement and management of retail loans: consumer loans, mortgages, credit cards for individuals, etc. Scoring is the tool used to decide to originate a loan, what amount should be originated and what strategies can help establish the price, because it is an algorithm that sorts transactions by their credit quality. This algorithm enables the BBVA Group to assign a score to each transaction requested by a customer, on the basis of a series of objective characteristics that have statistically been shown to discriminate between the quality and risk of this type of transactions. The advantage of scoring lies in its simplicity and homogeneity: all that is needed is a series of objective data for each customer, and this data is analyzed automatically using an algorithm.
There are three types of scoring, based on the information used and on its purpose:
- Reactive scoring: measures the risk of a transaction requested by an individual using variables relating to the requested transaction and to the customer’s socio-economic data available at the time of the request. The new transaction is approved or rejected depending on the score.
- Behavioral scoring: scores transactions for a given product in an outstanding risk portfolio of the entity, enabling the credit rating to be tracked and the customer’s needs to be anticipated. It uses transaction and customer variables available internally. Specifically, variables that refer to the behavior of both the product and the customer.
- Proactive scoring: gives a score at customer level using variables related to the individual’s general behavior with the entity, and to his/her payment behavior in all the contracted products. The purpose is to track the customer’s credit quality and it is used to pre-grant new transactions.
Rating
Rating tools, as opposed to scoring tools, do not assess transactions but focus on the rating of customers instead: companies, corporations, SMEs, public authorities, etc. A rating tool is an instrument that, based on a detailed financial study, helps determine a customer’s ability to meet his/her financial obligations. The final rating is usually a combination of various factors: on one hand, quantitative factors, and on the other hand, qualitative factors. It is a middle road between an individual analysis and a statistical analysis.
The main difference between ratings and scorings is that the latter are used to assess retail products, while ratings use a wholesale banking customer approach. Moreover, scorings only include objective variables, while ratings add qualitative information. And although both are based on statistical studies, adding a business view, rating tools give more weight to the business criterion compared to scoring tools.
For portfolios where the number of defaults is very low (sovereign risk, corporates, financial entities, etc.) the internal information is supplemented by “benchmarking” of the external rating agencies (Moody’s, Standard & Poor’s and Fitch). To this end, each year the PDs compiled by the rating agencies at each level of risk rating are compared, and the measurements compiled by the various agencies are mapped against those of the BBVA master rating scale.
Once the probability of default of a transaction or customer has been calculated, a "business cycle adjustment" is carried out. This is a means of establishing a measure of risk that goes beyond the time of its calculation. The aim is to capture representative information of the behavior of portfolios over a complete economic cycle. This probability is linked to the Master Rating Scale prepared by the BBVA Group to enable uniform classification of the Group’s various asset risk portfolios.
The table below shows the abridged scale used to classify the BBVA Group’s outstanding risk as of December 31, 2013:
Download Excel
| External rating Standard&Poor's List |
Internal rating Reduced List (22 groups) |
Probability of Default (basic points) | ||
|---|---|---|---|---|
| Average | Minimum from >= | Maximum | ||
| AAA | AAA | 1 | - | 2 |
| AA+ | AA+ | 2 | 2 | 3 |
| AA | AA | 3 | 3 | 4 |
| AA- | AA- | 4 | 4 | 5 |
| A+ | A+ | 5 | 5 | 6 |
| A | A | 8 | 6 | 9 |
| A- | A- | 10 | 9 | 11 |
| BBB+ | BBB+ | 14 | 11 | 17 |
| BBB | BBB | 20 | 17 | 24 |
| BBB- | BBB- | 31 | 24 | 39 |
| BB+ | BB+ | 51 | 39 | 67 |
| BB | BB | 88 | 67 | 116 |
| BB- | BB- | 150 | 116 | 194 |
| B+ | B+ | 255 | 194 | 335 |
| B | B | 441 | 335 | 581 |
| B- | B- | 785 | 581 | 1,061 |
| CCC | CCC+ | 1,191 | 1,061 | 1,336 |
| CCC | CCC | 1,500 | 1,336 | 1,684 |
| CCC | CCC- | 1,890 | 1,684 | 2,121 |
| CCC | CC+ | 2,381 | 2,121 | 2,673 |
| CCC | CC | 3,000 | 2,673 | 3,367 |
| CCC | CC- | 3,780 | 3,367 | 4,243 |
The table below outlines the distribution of exposure, including derivatives, by internal ratings, to corporates, financial entities and institutions (excluding sovereign risk), of the main BBVA Group entities as of December 31, 2013 and 2012:
Download Excel
| Credit Risk Distribution by Internal Rating | 2013 | 2012 | ||
|---|---|---|---|---|
| "Amount (Millions of Euros)" |
% | "Amount (Millions of Euros)" |
% | |
| AAA/AA+/AA/AA- | 23,541 | 10.34% | 24,091 | 9.95% |
| A+/A/A- | 65,834 | 28.92% | 73,526 | 30.37% |
| BBB+ | 24,875 | 10.93% | 31,951 | 13.20% |
| BBB | 23,953 | 10.52% | 23,410 | 9.67% |
| BBB- | 29,692 | 13.04% | 26,788 | 11.07% |
| BB+ | 19,695 | 8.65% | 15,185 | 6.27% |
| BB | 10,273 | 4.51% | 10,138 | 4.19% |
| BB- | 6,198 | 2.72% | 8,493 | 3.51% |
| B+ | 6,792 | 2.98% | 8,504 | 3.51% |
| B | 6,111 | 2.68% | 8,246 | 3.41% |
| B- | 4,804 | 2.11% | 5,229 | 2.16% |
| CCC/CC | 5,875 | 2.58% | 6,501 | 2.69% |
| Total | 227,643 | 100.00% | 242,064 | 100.00% |
These different levels and their probability of default were calculated by using as a reference the rating scales and default rates provided by the external agencies Standard & Poor’s and Moody’s. These calculations establish the levels of probability of default for the BBVA Group’s Master Rating Scale. Although this scale is common to the entire Group, the calibrations (mapping scores to PD sections/Master Rating Scale levels) are carried out at tool level for each country in which the Group has tools available.
7.1.5 Financial assets past due but not impaired
The table below provides details of financial assets past due as of December 31, 2013, 2012 and 2011, but not considered to be impaired, listed by their first past-due date:
Download Excel
| Financial Assets Past Due but Not Impaired 2013 | Millions of Euros | ||
|---|---|---|---|
| Less than 1 Month Past-Due |
1 to 2 Months Past-Due |
2 to 3 Months Past-Due |
|
| Loans and advances to credit institutions | - | - | - |
| Loans and advances to customers | 659 | 46 | 161 |
| Government | 56 | 3 | 6 |
| Other sectors | 603 | 43 | 155 |
| Debt securities | - | - | - |
| Total | 659 | 46 | 161 |
Download Excel
| Financial Assets Past Due but Not Impaired 2012 | Millions of Euros | ||
|---|---|---|---|
| Less than 1 Month Past-Due |
1 to 2 Months Past-Due |
2 to 3 Months Past-Due |
|
| Loans and advances to credit institutions | 21 | - | - |
| Loans and advances to customers | 1,067 | 620 | 310 |
| Government | 90 | 213 | 6 |
| Other sectors | 977 | 407 | 304 |
| Debt securities | - | - | - |
| Total | 1,088 | 620 | 310 |
Download Excel
| Financial Assets Past Due but Not Impaired 2011 | Millions of Euros | ||
|---|---|---|---|
| Less than 1 Month Past-Due |
1 to 2 Months Past-Due |
2 to 3 Months Past-Due |
|
| Loans and advances to credit institutions | - | - | - |
| Loans and advances to customers | 1,973 | 386 | 361 |
| Government | 186 | 47 | 23 |
| Other sectors | 1,787 | 339 | 338 |
| Debt securities | - | - | - |
| Total | 1,973 | 386 | 361 |
7.1.6 Impaired assets and impairment losses
The table below shows the composition of the impaired financial assets and risks as of December 31, 2013, 2012 and 2011, broken down by heading in the accompanying consolidated balance sheet:
Download Excel
| Impaired Risks. Breakdown by Type of Asset and by Sector |
Millions of Euros | ||
|---|---|---|---|
| 2013 | 2012 | 2011 | |
| Asset Instruments Impaired |
|
|
|
| Available-for-sale financial assets | 90 | 96 | 125 |
| Debt securities | 90 | 96 | 125 |
| Loans and receivables | 25,477 | 20,001 | 15,452 |
| Loans and advances to credit institutions | 29 | 26 | 26 |
| Loans and advances to customers | 25,445 | 19,960 | 15,416 |
| Debt securities | 4 | 15 | 10 |
| Total Asset Instruments Impaired (1) | 25,568 | 20,097 | 15,577 |
| Contingent Risks Impaired |
|
|
|
| Contingent Risks Impaired (2) | 410 | 312 | 217 |
| Total impaired risks (1) + (2) | 25,978 | 20,409 | 15,793 |
| Of which: |
|
|
|
| Government | 170 | 165 | 135 |
| Credit institutions | 48 | 71 | 81 |
| Other sectors | 25,350 | 19,861 | 15,359 |
| Mortgage | 18,327 | 13,761 | 9,615 |
| With partial secured loans | 49 | 48 | 52 |
| Rest | 6,974 | 6,052 | 5,693 |
| Contingent Risks Impaired | 410 | 312 | 217 |
| Total impaired risks (1) + (2) | 25,978 | 20,409 | 15,793 |
All doubtful or impaired risks fall into this category individually, either by default or nonperforming criteria, or for reasons other than its default. The BBVA group classification as impaired financial assets is as follows::
- The classification of financial assets impaired due to customer default is objective and individualized to the following criteria:
- The total amount of debt instruments, whoever the holder and collateral, which have principal, interest or fees amounts past due for more than 90 days as contractually agreed following objective criteria through aging calculation systems, unless directly classified as charged off.
- Contingent risks where the third party collateral individual becomes impaired.
- The classification of financial assets impaired by reasons other than customer default is performed individually for all risks whose individual amount is material where there is reasonable doubt about their full repayment on contractually agreed terms as they show objective evidence of impairment adversely affected by the expected cash flows of the financial instrument. Objective evidence of impairment of an asset or group of financial assets includes observable data about the following:
- Debtor’s material financial difficulties.
- Continuous delay in interest of principal payments.
- Refinancing of credit conditions by the counterparty.
- Probable bankruptcy or other reorganization / liquidation.
- Lack of an active market for a financial asset because of financial difficulties.
- Observable data indicating a reduction in future cash flows from the initial recognition such as: a. Adverse changes in the payment status of the counterparty (delays in payments, provisions for credit cards to the limit, etc.).
- National or local economic conditions that are correlated with “defaults” (unemployment, falling property prices, etc.).
The breakdown of impaired loans for default or reasons other than delinquency as of December 31, 2013.
Download Excel
| December 2013 | Millions of Euros | |
|---|---|---|
| Impaired | Allowance for impaired porfolio |
|
| Balance of impaired loans - Past due | 16,558 | 8,503 |
| Balance of impaired loans - Other than past due | 9,010 | 2,760 |
| TOTAL | 25,568 | 11,263 |
| Of which: |
|
|
| No risk | 235 | 122 |
| Mortgage loans | 18,327 | 6,688 |
| Secured loans, except mortgage | 49 | 20 |
| Other | 6,957 | 4,433 |
Provisions related to impaired loans secured by mortgage basically correspond to the difference between the fair value of the collateral and the carrying value.
Below are the details of the impaired financial assets as of December 31, 2013, 2012 and 2011, classified by geographical area and by the time since their oldest past-due amount or the period since they were deemed impaired:
Download Excel
| Impaired Assets by Geographic Area and Time Since Oldest Past-Due Amount 2013 | Millions of Euros | ||||
|---|---|---|---|---|---|
| Less than 6 Months Past-Due |
6 to 9 Months Past-Due |
9 to 12 Months Past-Due |
More than 12 Months Past-Due |
Total | |
| Spain | 9,930 | 1,873 | 1,375 | 8,599 | 21,777 |
| Rest of Europe | 383 | 25 | 38 | 239 | 685 |
| Mexico | 795 | 148 | 114 | 410 | 1,467 |
| South America | 854 | 68 | 58 | 116 | 1,096 |
| The United States | 481 | 16 | 8 | 38 | 543 |
| Total | 12,443 | 2,130 | 1,593 | 9,402 | 25,568 |
Download Excel
| Impaired Assets by Geographic Area and Time Since Oldest Past-Due Amount 2012 | Millions of Euros | ||||
|---|---|---|---|---|---|
| Less than 6 Months Past-Due |
6 to 9 Months Past-Due |
9 to 12 Months Past-Due |
More than 12 Months Past-Due |
Total | |
| Spain | 6,476 | 1,703 | 1,534 | 6,399 | 16,112 |
| Rest of Europe | 380 | 47 | 28 | 168 | 623 |
| Mexico | 941 | 112 | 153 | 289 | 1,495 |
| South America | 837 | 115 | 41 | 116 | 1,109 |
| The United States | 639 | 26 | 13 | 80 | 758 |
| Total | 9,273 | 2,003 | 1,770 | 7,052 | 20,097 |
Download Excel
| Impaired Assets by Geographic Area and Time Since Oldest Past-Due Amount 2011 | Millions of Euros | ||||
|---|---|---|---|---|---|
| Less than 6 Months Past-Due |
6 to 9 Months Past-Due |
9 to 12 Months Past-Due |
More than 12 Months Past-Due |
Total | |
| Spain | 4,640 | 1,198 | 1,187 | 4,482 | 11,507 |
| Rest of Europe | 149 | 26 | 33 | 91 | 299 |
| Mexico | 809 | 141 | 130 | 199 | 1,280 |
| South America | 767 | 66 | 38 | 109 | 980 |
| The United States | 634 | 211 | 117 | 549 | 1,511 |
| Total | 7,000 | 1,642 | 1,505 | 5,429 | 15,577 |
Below are the details of the impaired financial assets as of December 31, 2013, 2012 and 2011, classified by type of loan according to its associated guarantee, and by the time since their oldest past-due amount or the period since they were deemed impaired:
Download Excel
| Impaired Assets by Type of Guarantees and Time Since Oldest Past-Due Amount 2013 | Millions of Euros | ||||
|---|---|---|---|---|---|
| Less than 6 Months Past-Due |
6 to 9 Months Past-Due |
9 to 12 Months Past-Due |
More than 12 Months Past-Due |
Total | |
| Unsecured loans | 4,689 | 529 | 375 | 1,364 | 6,957 |
| Mortgage | 7,470 | 1,601 | 1,218 | 8,038 | 18,327 |
| Residential mortgage | 3,250 | 406 | 432 | 2,390 | 6,478 |
| Commercial mortgage (rural properties in operation and offices, and industrial buildings) | 1,194 | 248 | 163 | 1,352 | 2,957 |
| Other than those currently use as a family residential property of the borrower | 938 | 225 | 323 | 2,029 | 3,515 |
| Plots and other real estate assets | 2,088 | 722 | 300 | 2,267 | 5,377 |
| Other partially secured loans | 49 | - | - | - | 49 |
| Others | 235 | - | - | - | 235 |
| Total | 12,443 | 2,130 | 1,593 | 9,402 | 25,568 |
Download Excel
| Impaired Assets by Type of Guarantees and Time Since Oldest Past-Due Amount 2012 | Millions of Euros | ||||
|---|---|---|---|---|---|
| Less than 6 Months Past-Due |
6 to 9 Months Past-Due |
9 to 12 Months Past-Due |
More than 12 Months Past-Due |
Total | |
| Unsecured loans | 4,145 | 539 | 409 | 1,195 | 6,288 |
| Mortgage | 5,080 | 1,464 | 1,360 | 5,857 | 13,761 |
| Residential mortgage | 1,570 | 516 | 457 | 1,796 | 4,339 |
| Commercial mortgage (rural properties in operation and offices, and industrial buildings) | 715 | 251 | 190 | 1,111 | 2,267 |
| Other than those currently use as a family residential property of the borrower | 732 | 330 | 318 | 1,162 | 2,542 |
| Plots and other real estate assets | 2,063 | 367 | 395 | 1,788 | 4,613 |
| Other partially secured loans | 48 | - | - | - | 48 |
| Others | - | - | - | - | - |
| Total | 9,273 | 2,003 | 1,770 | 7,052 | 20,097 |
Download Excel
| Impaired Assets by Type of Guarantees and Time Since Oldest Past-Due Amount 2011 | Millions of Euros | ||||
|---|---|---|---|---|---|
| Less than 6 Months Past-Due |
6 to 9 Months Past-Due |
9 to 12 Months Past-Due |
More than 12 Months Past-Due |
Total | |
| Unsecured loans | 3,382 | 588 | 528 | 1,411 | 5,910 |
| Mortgage | 3,567 | 1,054 | 977 | 4,016 | 9,615 |
| Residential mortgage | 1,081 | 390 | 357 | 1,373 | 3,202 |
| Commercial mortgage (rural properties in operation and offices, and industrial buildings) | 629 | 210 | 160 | 795 | 1,794 |
| Rest of residential mortgage | 489 | 137 | 166 | 653 | 1,445 |
| Plots and other real estate assets | 1,369 | 316 | 294 | 1,194 | 3,174 |
| Other partially secured loans | 52 | - | - | - | 52 |
| Others | - | - | - | - | - |
| Total | 7,000 | 1,642 | 1,505 | 5,429 | 15,577 |
The breakdown of impaired loans by sector as of December 31, 2012 and 2013 is shown below:
Download Excel
| Impaired loans by sector | Millions of Euros | |||||
|---|---|---|---|---|---|---|
| 2013 | 2012 | |||||
| Impaired Loans | Loan Loss Reserve | Impaired Loans as a % of Loans by Type | Impaired Loans | Loan Loss Reserve | Impaired Loans as a % of Loans by Type | |
| Domestic: |
|
|
|
|
|
|
| Government | 158 | (11) | 0.71% | 145 | (10) | 0.57% |
| Credit institutions | - | - | 0.00% | 6 | - | - |
| Other sectors: | 20,826 | (10,268) | 12.60% | 15,013 | (7,120) | 8.25% |
| Agriculture | 142 | (70) | 11.18% | 123 | (44) | 8.65% |
| Industrial | 1,804 | (886) | 13.10% | 914 | (387) | 5.56% |
| Real estate and construction | 10,387 | (6,084) | 41.02% | 8,032 | (4,660) | 26.19% |
| Commercial and other financial | 1,103 | (579) | 7.10% | 989 | (350) | 5.74% |
| Loans to individuals | 5,745 | (1,660) | 6.36% | 3,733 | (1,171) | 3.88% |
| Other | 1,645 | (988) | 8.67% | 1,222 | (508) | 6.09% |
| Total Domestic | 20,985 | (10,279) | 10.89% | 15,164 | (7,130) | 7.20% |
| Foreign: |
|
|
|
|
|
|
| Government | 11 | (4) | 0.11% | 20 | (1) | 0.21% |
| Credit institutions | 33 | (26) | 0.19% | 29 | (22) | 0.13% |
| Other sectors: | 4,449 | (2,290) | 3.20% | 4,787 | (2,242) | 3.47% |
| Agriculture | 170 | (137) | 4.59% | 178 | (92) | 5.43% |
| Industrial | 288 | (159) | 1.93% | 146 | (109) | 1.02% |
| Real estate and construction | 1,734 | (715) | 11.44% | 1,661 | (469) | 9.98% |
| Commercial and other financial | 269 | (166) | 0.85% | 703 | (471) | 2.05% |
| Loans to individuals | 1,202 | (646) | 2.02% | 1,937 | (961) | 3.50% |
| Other | 785 | (467) | 5.54% | 162 | (140) | 1.14% |
| Total Foreign | 4,493 | (2,320) | 2.69% | 4,836 | (2,265) | 2.85% |
| General reserve | - | (2,396) |
|
- | (4,764) |
|
| Total impaired loans | 25,478 | (14,995) |
|
20,000 | (14,159) |
|
The table below represents the accumulated financial income accrued as of December 31, 2013, 2012 and 2011 with origin in the impaired assets that, as mentioned in Note 2.2.1, are not recognized in the accompanying consolidated income statements as there are doubts as to the possibility of collection:
Download Excel
|
|
Millions of Euros | ||
|---|---|---|---|
|
|
2013 | 2012 | 2011 |
| Financial Income from Impaired Assets | 3,360 | 2,405 | 1,908 |
The changes in the year ended December 31, 2013, 2012 and 2011 in the impaired financial assets and contingent risks are as follows:
Download Excel
| Changes in Impaired Financial Assets and Contingent Risks | Millions of Euros | ||
|---|---|---|---|
| 2013 | 2012 | 2011 | |
| Balance at the beginning | 20,409 | 15,793 | 15,936 |
| Additions (A) | 17,708 | 14,318 | 13,001 |
| Decreases (B) | (7,692) | (8,236) | (8,953) |
| Cash collections and return to performing | (6,593) | (5,968) | (5,726) |
| Foreclosed assets (1) | (1,025) | (1,098) | (1,404) |
| Real estate assets received in lieu of payment (2) | (74) | (1,170) | (1,823) |
| Net additions (A)+(B) | 10,016 | 6,081 | 4,048 |
| Amounts written-off | (3,825) | (4,372) | (4,093) |
| Exchange differences and other (including Unnim) | (622) | 2,906 | (98) |
| Balance at the end | 25,978 | 20,409 | 15,793 |
The changes in the year ended December 31, 2013, 2012 and 2011 in financial assets derecognized from the accompanying consolidated balance sheet as their recovery is considered unlikely (hereinafter “write-offs”) is shown below:
Download Excel
| Changes in Impaired Financial Assets Written-Off from the Balance Sheet | Millions of Euros | ||
|---|---|---|---|
| 2013 | 2012 | 2011 | |
| Balance at the beginning | 19,265 | 15,870 | 13,367 |
| Increase: | 4,450 | 4,363 | 4,251 |
| Decrease: | (2,319) | (1,753) | (1,863) |
| Re-financing or restructuring | (1) | (9) | (4) |
| Cash recovery | (362) | (337) | (326) |
| Foreclosed assets | (96) | (133) | (29) |
| Sales of written-off | (1,000) | (283) | (809) |
| Debt forgiveness | (685) | (541) | (604) |
| Time-barred debt and other causes | (175) | (450) | (91) |
| Net exchange differences | (645) | 785 | 114 |
| Balance at the end | 20,752 | 19,265 | 15,870 |
As indicated in Note 2.2.1, although they have been derecognized from the balance sheet, the BBVA Group continues to attempt to collect on these write-offs, until the rights to receive them are fully extinguished, either because it is time-barred debt, the debt is forgiven, or other reasons.
7.1.7 Impairment losses
Below is a breakdown of the provisions recognized on the accompanying consolidated balance sheets to cover estimated impairment losses as of December 31, 2013, 2012 and 2011 in financial assets and contingent risks, according to the different headings under which they are classified in the accompanying consolidated balance sheet:
Download Excel
| Impairment losses and provisions for contingent risks |
|
Millions of Euros | ||
|---|---|---|---|---|
| Notes | 2013 | 2012 | 2011 | |
| Available-for-sale portfolio | 12 | 198 | 339 | 566 |
| Loans and receivables | 13 | 14,995 | 14,159 | 9,139 |
| Loans and advances to customers | 13.2 | 14,950 | 14,115 | 9,091 |
| Loans and advances to credit institutions | 13.1 | 40 | 29 | 38 |
| Debt securities | 13.3 | 5 | 15 | 11 |
| Held to maturity investment | 14 | - | - | 1 |
| Impairment losses |
|
15,192 | 14,498 | 9,705 |
| Provisions to Contingent Risks and Commitments | 25 | 346 | 322 | 266 |
| Total |
|
15,538 | 14,820 | 9,971 |
| Of which: |
|
|
|
|
| For impaired portfolio |
|
12,969 | 9,861 | 6,883 |
| For currently non-impaired portfolio |
|
2,569 | 4,959 | 3,088 |
Below are the changes in the years ended December 31, 2013, 2012 and 2011 in the estimated impairment losses, broken down by the headings in the accompanying consolidated balance sheet:
Download Excel
|
|
|
Millions of Euros | |||
|---|---|---|---|---|---|
| 2013 | Notes | Available-for-sale portfolio | Loans and receivables | Contingent Risks and Commitments | Total |
| Balance at the beginning |
|
339 | 14,159 | 322 | 14,820 |
| Increase in impairment losses charged to income |
|
55 | 10,816 | 85 | 10,955 |
| Decrease in impairment losses credited to income |
|
(19) | (4,878) | (46) | (4,944) |
| Impairment losses (net)(*) | 48-49 | 36 | 5,938 | 38 | 6,011 |
| Entities incorporated/disposed in the year |
|
- | (30) | (1) | (31) |
| Transfers to written-off loans |
|
(164) | (3,673) | - | (3,838) |
| Exchange differences and other |
|
(12) | (1,398) | (13) | (1,424) |
| Balance at the end |
|
198 | 14,995 | 346 | 15,538 |
Download Excel
|
|
|
Millions of Euros | |||
|---|---|---|---|---|---|
| 2012 | Notes | Available-for-sale portfolio | Loans and receivables | Contingent Risks and Commitments | Total |
| Balance at the beginning |
|
566 | 9,138 | 266 | 9,970 |
| Increase in impairment losses charged to income |
|
71 | 10,419 | 91 | 10,581 |
| Decrease in impairment losses credited to income |
|
(30) | (2,266) | (36) | (2,331) |
| Impairment losses (net)(*) | 48-49 | 41 | 8,153 | 55 | 8,250 |
| Entities incorporated/disposed in the year |
|
1 | 2,066 | 5 | 2,073 |
| Transfers to written-off loans |
|
(18) | (4,107) | - | (4,125) |
| Exchange differences and other |
|
(251) | (1,092) | (4) | (1,348) |
| Balance at the end |
|
339 | 14,159 | 322 | 14,821 |
Download Excel
|
|
|
Millions of Euros | |||
|---|---|---|---|---|---|
| 2011 | Notes | Available-for-sale portfolio | Loans and receivables | Contingent Risks and Commitments | Total |
| Balance at the beginning |
|
619 | 9,473 | 264 | 10,356 |
| Increase in impairment losses charged to income |
|
60 | 5,963 | 16 | 6,038 |
| Decrease in impairment losses credited to income |
|
(37) | (1,473) | (24) | (1,534) |
| Impairment losses (net)(*) | 48-49 | 23 | 4,490 | (8) | 4,504 |
| Entities incorporated/disposed in the year |
|
- | 32 | - | 32 |
| Transfers to written-off loans |
|
(75) | (4,039) | - | (4,114) |
| Exchange differences and other |
|
(1) | (818) | 11 | (808) |
| Balance at the end |
|
566 | 9,138 | 266 | 9,972 |
7.1.8 Refinancing and restructuring operations
Group policies and principles with respect to refinancing or restructuring operations
Refinancing/restructuring operations (see definition in the Glossary) are carried out with customers who have requested such an operation in order to meet their current debt payments if they are expected, or may be expected, to experience financial difficulty in making the payments in the future.
The basic aim of a refinanced/restructured operation is to provide the customer with a situation of financial viability over time by adapting repayment of the debt incurred with the Group to the customer’s new situation of fund generation. The use of refinancing or restructuring with for other purposes, such as for delaying loss recognition, is contrary to BBVA Group policies.
The BBVA Group’s refinancing/restructuring policies are based on the following general principles:
- Refinancing and restructuring is authorized according to the capacity of customers to pay the new installments. This is done by first identifying the origin of the payment difficulties and then carrying out an analysis of the customers’ viability, including an updated analysis of their economic and financial situation and capacity to pay and generate funds. If the customer is a company, the analysis also covers the situation of the sector in which it operates.
- With the aim of increasing the solvency of the operation, new guarantees and/or guarantors of demonstrable solvency are obtained where possible. An essential part of this process is an analysis of the effectiveness of both the new and original guarantees submitted.
- This analysis is carried out from the overall customer or group perspective, and not only from the perspective of a specific operation.
- Refinancing and restructuring operations do not in general increase the amount of the customer’s debt, except for the expenses inherent to the operation itself.
- The capacity to refinance and restructure debt is not delegated to the branches, but decided on by the risk units.
- The decisions adopted are reviewed from time to time with the aim of checking full compliance with refinancing and restructuring policies.
These general principles are adapted in each case according to the conditions and circumstances of each geographical area in which the Group operates, and to the different types of customers involved.
In the case of retail customers (private individuals), the main aim of the BBVA Group’s policy on refinancing/restructuring debt is to avoid default arising from a customer’s temporary liquidity problems by implementing structural solutions that do not increase the customer’s debt. The solution required is adapted to each case and the debt repayment is made easier, in accordance with the following principles:
- Analysis of the viability of operations based on the customer’s willingness and ability to pay, which may be reduced, but should nevertheless be present. The customer must therefore repay at least the interest on the operation in all cases. No arrangements may be concluded that involve a grace period for both capital and interest.
- No refinancing/restructuring operations may be concluded on debt that is not incurred with the BBVA Group.
- Customers subject to refinancing or restructuring operations are excluded from commercial campaigns of any kind.
In the case of wholesale customers (basically businesses and corporations), refinancing/restructuring is authorized according to an economic and financial viability plan based on:
- Forecast future income, margins and cash flows over a sufficiently long period (around five years) to allow entities to implement cost adjustment measures (industrial restructuring) and a business development plan that can help reduce the level of leverage to sustainable levels (capacity to access the financial markets).
- Where appropriate, the existence of a divestment plan for assets and/or business segments that can generate cash to assist the deleveraging process.
- The capacity of shareholders to contribute capital and/or guarantees that can support the viability plan.
In accordance with the Group’s policy, the conclusion of a debt refinancing/restructuring operation does not imply the debt is reclassified from "impaired" or "substandard" to outstanding risk; such a reclassification must be based on the analysis mentioned earlier of the viability and effectiveness of the new guarantees submitted.
The Group maintains the policy of including risks related to refinanced/restructured assets as either:
- "Doubtful assets", as although the customer is up to date with payments, they are classified as impaired for reasons other than their default when there are significant doubts that the terms of their refinancing may not be met;.
- "Substandard assets", because there is some material doubt as to possible non-compliance with the refinanced operation; or.
- "Normal-risk assets" (although as mentioned in the table in the following section, they continue to be classified as "normal-risk assets with special monitoring" until the conditions established for their consideration as outstanding risk are met).
The conditions established for “normal-risk assets with special monitoring” to be reclassified out of this special monitoring category are as follows:
- The customer must have paid past-due amounts (principal and interest) since the date of the renegotiation or restructuring of the operation;
- At least two years must have elapsed since the renegotiation or restructuring of the operation;
- The customer must have paid at least 20% of the outstanding principal amount of the loan as well as all the past-due amounts (principal and interest) that were outstanding as of the date of the renegotiation or restructuring of the operation; and
- It is unlikely that the borrower will have financial difficulties and, therefore, it is expected that the borrower will be able to meet its debt payment obligations (principal and interest) in a timely manner.
The BBVA Group’s refinancing/restructuring policy provides for the possibility of multiple modifications, which shall be approved on an individual basis based on the risk profile of the relevant customer and its degree of compliance with the prior payment calendar.
The internal models used to determine allowances for loan losses consider the restructuring or renegotiation of a loan, as well as re-defaults on a loan, by assigning a lower internal rating to restructured/renegotiated loans than the average internal rating assigned to non-restructured/renegotiated loans. This downgrade results in an increase in the probability of default (PD) assigned to restructured/renegotiated loans (with the resulting PD being higher than the average PD of the non- renegotiated loans in the same portfolios).”
Quantitative information on refinancing and restructuring operations:
Download Excel
| BBVA GROUP DECEMBER 2013 BALANCE OF FORBEARANCE (Millions of Euros) |
||||||
|---|---|---|---|---|---|---|
|
|
NORMAL | |||||
|
|
Real estate mortgage secured | Rest of secured loans (a) | Unsecured loans | |||
|
|
Number of operations | Gross amount | Number of operations | Gross amount | Number of operations | Gross amount |
| 1 Government agencies | 4 | 466 | 13 | 45 | 29 | 811 |
| 2 Other legal entities and individual entrepreneurs | 7,289 | 2,108 | 1,121 | 204 | 22,531 | 2,380 |
| Of which: Financing the construction and property development | 1,131 | 635 | 72 | 20 | 306 | 199 |
| 3 Other individuals | 60,366 | 2,587 | 5,506 | 643 | 87,169 | 414 |
| 4 Total | 67,659 | 5,161 | 6,640 | 892 | 109,729 | 3,605 |
Download Excel
|
|
POTENTIAL PROBLEM LOANS | ||||||
|---|---|---|---|---|---|---|---|
|
|
Real estate mortgage secured | Rest of secured loans (a) | Unsecured loans | Specific coverage | |||
|
|
Number of operations | Gross amount | Number of operations | Gross amount | Number of operations | Gross amount |
|
| 1 Government agencies | 1 | 1 | - | - | 2 | 25 | 1 |
| 2 Other legal entities and individual entrepreneurs | 3,014 | 1,381 | 867 | 468 | 8,158 | 1,497 | 641 |
| Of which: Financing the construction and property development | 640 | 623 | 131 | 178 | 142 | 123 | 322 |
| 3 Other individuals | 31,883 | 1,987 | 5,681 | 837 | 22,496 | 231 | 218 |
| 4 Total | 34,898 | 3,369 | 6,548 | 1,304 | 30,656 | 1,753 | 860 |
Download Excel
|
|
IMPAIRED | ||||||
|---|---|---|---|---|---|---|---|
|
|
Real estate mortgage secured | Rest of secured loans (a) | Unsecured loans | Specific coverage | |||
|
|
Number of operations | Gross amount | Number of operations | Gross amount | Number of operations | Gross amount |
|
| 1 Government agencies | 1 | 1 | 4 | 13 | 13 | 2 | 0 |
| 2 Other legal entities and individual entrepreneurs | 8,446 | 4,998 | 4,529 | 3,066 | 16,761 | 2,001 | 4,821 |
| Of which: Financing the construction and property development | 3,264 | 3,370 | 2,508 | 2,441 | 1,146 | 580 | 3,435 |
| 3 Other individuals | 34,248 | 2,094 | 13,111 | 2,314 | 59,463 | 347 | 1,243 |
| 4 Total | 42,695 | 7,093 | 17,644 | 5,392 | 76,237 | 2,349 | 6,065 |
Download Excel
|
|
TOTAL | ||||||
|---|---|---|---|---|---|---|---|
|
|
Real estate mortgage secured | Rest of secured loans (a) | Unsecured loans | Specific coverage | |||
|
|
Number of operations | Gross amount | Number of operations | Gross amount | Number of operations | Gross amount |
|
| 1 Government agencies | 6 | 468 | 17 | 58 | 44 | 838 | 1 |
| 2 Other legal entities and individual entrepreneurs | 18,749 | 8,488 | 6,517 | 3,737 | 47,450 | 5,878 | 5,463 |
| Of which: Financing the construction and property development | 5,035 | 4,629 | 2,711 | 2,640 | 1,594 | 901 | 3,757 |
| 3 Other individuals | 126,497 | 6,667 | 24,298 | 3,793 | 169,128 | 991 | 1,462 |
| 4 Total | 145,252 | 15,623 | 30,832 | 7,588 | 216,622 | 7,707 | 6,925 |
In addition to these restructuring and refinancing transactions mentioned in this section, loans that were not considered impaired or renegotiated have been modified based on the criteria set out in paragraph 59 (c) of IAS 39. These loans have not been classified as renegotiated or impaired, since they were modified for commercial or competitive reasons (for instance, to improve our relationship with the client) rather than for economic or legal reasons relating to the borrower's financial situation.
NPL Ratio by type of renegotiated loan
The non performing ratio of the renegotiated portfolio is defined as the impaired balance of renegotiated loans that shows signs of difficulties as of the closing of the reporting period, divided by the total payment outstanding in that portfolio.
As of December 31, 2013, the non performing ratio for each of the portfolios of renegotiated loans is as follows:
Download Excel
| December 2013 NPL ratio renegotiated loan portfolio |
|
|---|---|
| Government agencies | 1% |
| Commercial | 56% |
| Of which: Construction and developer | 78% |
| Other consumer | 42% |
45% of the renegotiated loans classified as doubtful was for reasons other than default (delinquency).
7.2 Market risk
Most of the headings on the Group's balance sheet that are subject to market risk are positions whose main metric for measuring their market risk is VaR.
Trading portfolio activities
The activity of each of the Group's trading floors is controlled and monitored by the risk unit. Measurement procedures are established in terms of the possible impact of negative market conditions on the trading portfolio of the Group's Global Markets units, both under ordinary circumstances and in situations of heightened risk factors.
The measurement model used to assess market risk is Value at Risk (VaR), which provides a forecast with a 99% probability of the maximum loss that can be incurred by the market positions of trading portfolios in a one-day horizon, stemming from fluctuations in equity prices, interest rates, foreign-exchange rates and commodity prices. In addition, for some positions, other risks also need to be considered, such as credit spread risk, basis risk, volatility and correlation risk.
BBVA and BBVA Bancomer have received approval from the Bank of Spain to use a model developed by the BBVA Group to calculate bank capital requirements for market risk. This model estimates VaR in accordance with the “historical simulation” methodology, which involves estimating the losses or gains that would have been produced in the current portfolio if the changes in market conditions occurring over a specific period of time were repeated. Using this information, it infers the maximum foreseeable loss in the current portfolio with a given level of confidence. It has the advantage of precisely reflecting the historical distribution of the market variables and not requiring any assumption of specific probability distribution. The historical period used in this model is two years.
In addition, the Bank follows the guidelines set out by Spanish and European authorities regarding other metrics to meet the Bank of Spain’s regulatory requirements. The new measurements of market risk for the trading portfolio include the calculation of stressed VaR (which quantifies the level of risk in extreme historical situations) and the quantification of default risks and downgrading of credit ratings of bonds and credit portfolio derivatives.
The limits structure of the BBVA Group's market risk determines a system of VaR and economic capital limits by market risk for each operating segment, with specific ad-hoc sub-limits by type of risk, activity and trading desk.
Validity tests are performed periodically on the risk measurement models used by the Group. They estimate the maximum loss that could have been incurred in the positions assessed with a certain level of probability (backtesting), as well as measurements of the impact of extreme market events on risk positions (stress testing). As an additional control measure, backtesting is conducted at trading desk level in order to enable more specific monitoring of the validity of the measurement models.
Trends in market risk
The changes in the BBVA Group’s market risk in 2013, measured as VaR without smoothing, with a 99% confidence level and a 1-day horizon, are as follows:
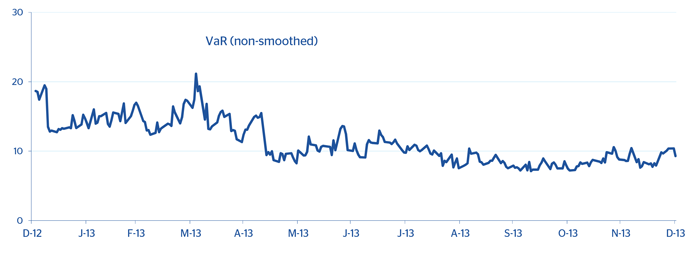
By geographical area, and as an annual average in 2013, 49.2% of the market risk corresponds to Global Markets (GM) Europe and GM Compass and 50.8% to the Group’s banks in Latin America, of which 35.0% is in GM Bancomer.
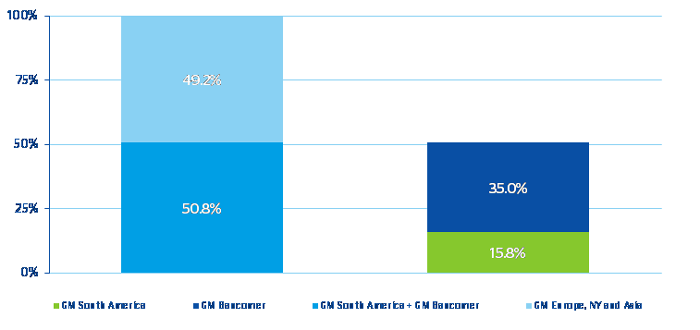
The average VaR in 2013 stood at €23 million, compared with €22 million in 2012 and €24 million in 2011. The number of risk factors currently used to measure portfolio risk is around 3,600. This number is dynamic and varies according to the possibility of doing business in other underlying assets and markets.
As of December 30, 2013, 2012 and 2011 VaR amounted to €22 million, €30 million and €18 million, respectively. These figures can be broken down as follows:
Download Excel
| VaR by Risk Factor | Millions of Euros | |||||
|---|---|---|---|---|---|---|
| Interest/Spread risk | Currency risk | Stock-market risk | Vega/Correlation risk | Diversification effect(*) | Total | |
| 2013 |
|
|
|
|
|
|
| VaR average in the period |
|
|
|
|
|
23 |
| VaR max in the period | 39 | 4 | 2 | 13 | (24) | 34 |
| VaR min in the period | 19 | 3 | 2 | 11 | (18) | 17 |
| End of period VaR | 22 | 4 | 3 | 11 | (18) | 22 |
| 2012 |
|
|
|
|
|
|
| VaR average in the period |
|
|
|
|
|
22 |
| VaR max in the period | 35 | 2 | 3 | 11 | (21) | 31 |
| VaR min in the period | 21 | 3 | 1 | 11 | (21) | 15 |
| End of period VaR | 35 | 3 | 3 | 9 | (19) | 30 |
| 2011 |
|
|
|
|
|
|
| VaR average in the period |
|
|
|
|
|
24 |
| VaR max in the period |
|
|
|
|
|
36 |
| VaR min in the period |
|
|
|
|
|
16 |
| End of period VaR | 27 | 3 | 7 | 4 | (23) | 18 |
By type of market risk assumed by the Group’s trading portfolio, as of December 31, 2013, the main risks were interest-rate and credit spread risks, which declined by €13 million on the figure for December 31, 2012. Currency risk increased by €1 million and volatility and correlation risk increased by €2 million. Equity risk remained without significant changes with respect to the close of 2012.
The average daily change in VaR in 2013 on 2012 is basically due to Global Market Bancomer and Global Market South America increasing their average risk by 57% and 7% respectively in 2013 (with an average daily VaR of €8 million and €4 million, respectively). Global Market Europe reduced its average risk by 18% (with an average daily VaR in 2013 of €11 million).
Model validation
The internal market risk model is validated periodically by backtesting, both in BBVA, S.A. and in Bancomer.
The aim of backtesting is to validate the quality and precision of the internal model used by the BBVA Group to estimate the maximum daily loss of a portfolio, at a 99% level of confidence and a 250-day time horizon, by comparing the Group's results and the measurements of risk generated by the model. These tests showed that the internal market risk model of both BBVA, S.A. and Bancomer is adequate and precise.
Two types of backtesting were carried out in 2013:
1. "Hypothetical" backtesting: the daily VaR is compared with the results obtained, not taking into account the intraday results or the changes in the portfolio positions. This validates the appropriateness of the market risk metrics for the end-of-day position.
2. "Real" backtesting: the daily VaR is compared with the total results, including intraday transactions, but discounting the possible minimum charges or fees involved. This type of backtesting includes the intraday risk in portfolios.
In addition, each of these two types of backtesting was carried out at the level of risk factor or business type, thus making a deeper comparison of the results with respect to risk measurements.
In 2013, Bancomer carried out backtesting of the internal calculation model of VaR, comparing the daily results obtained with the estimated risk level estimated by the VaR calculation model. At the end of the year the comparison showed the model was functioning correctly, within the "green" zone (0-4 exceptions), thus validating the model, as has occurred each year since the internal market risk model was approved for the Group.
Backtesting in BBVA, S.A. did not reveal any exception in the year 2013. The sovereign debt and Spanish corporate credit spreads continued to narrow during the year and the equity markets have in general moved upward. To sum up, the backtesting carried out in 2013, both at the global group level and at the level of risk factor, did not detect any type of anomaly in the VaR calculation model.
In the case of Bancomer, portfolio losses only exceeded the daily VaR on one occasion, thus also validating the correct operation of the model according to Basel criteria.
| Backtesting of the market risk model for BBVA SA | Backtesting of the market risk model for BBVA Bancomer |
|---|---|
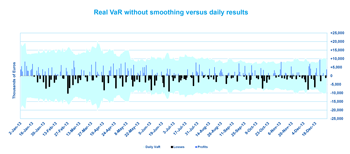
|
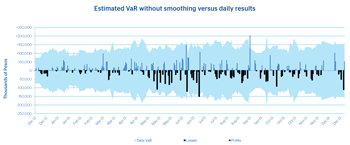
|
Estimated VaR without smoothing versus daily results
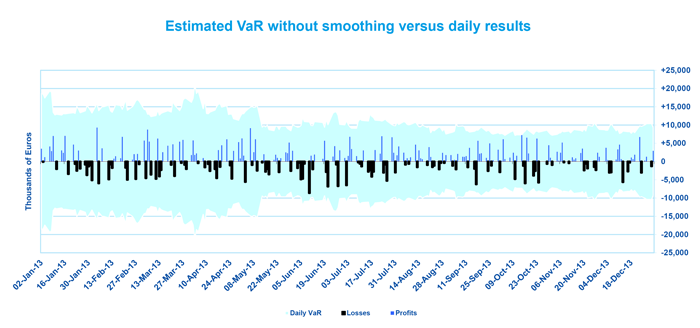
Stress test analysis
A number of stress tests are carried out on the BBVA Group's trading portfolios. First, global and local historical scenarios are used that replicate the behavior of an extreme past event, such as for example the collapse of Lehman Brothers or the "Tequilazo" crisis. These stress tests are complemented with simulated scenarios, where the aim is to generate scenarios that have a significant impact on the different portfolios, but without being anchored to any specific historical scenario. Finally, for some portfolios or positions, fixed stress tests are also carried out that have a significant impact on the market variables affecting these positions.
Historical scenarios
The historical benchmark stress scenario for the BBVA Group is Lehman Brothers, whose sudden collapse in September 2008 led to a significant impact on the behavior of financial markets at a global level. The following are the most relevant effects of this historical scenario:
- Credit shock: reflected mainly in the increase of credit spreads and downgrades in credit ratings.
- Increased volatility in most of the financial markets (giving rise to a great deal of variation in the prices of different assets (currency, equity, debt).
- Liquidity shock in the financial systems, reflected by a major movement in interbank curves, particularly in the shortest sections of the euro and dollar curves.
Simulated scenarios
Unlike the historical scenarios, which are fixed and thus do not adapt to the composition of portfolio risks at any one time, the scenario used to carry out the economic stress tests are based on a resampling methodology. This methodology uses dynamic scenarios that are recalculated regularly according to the main risks in the trading portfolios at any time. A simulation exercise is carried out on a window of data that is sufficiently extensive to include different periods of stress (data are taken from January 1, 2008 through to today), using a resampling of the historical observations. This generates a distribution of losses and gains that provides an analysis of the most extreme events occurred within the selected historical window. The advantage of this methodology is that the stress period is not pre-established, but rather a function of the portfolio held at any time. As it makes a high number of simulations (10,000) it can analyze the expected shortfall with greater richness of information than that available in the scenarios included in the VaR calculation.
The main characteristics of this methodology are the following:
- The simulations generated respect the data correlation structure.
- There is flexibility in terms of inclusion of new risk factors.
- It allows a great deal of variability to be introduced into the simulations (desirable for considering extreme events).
Structural risk
Structural interest-rate risk
The aim of on-balance-sheet interest-rate risk management is to maintain the BBVA Group’s exposure to market interest-rate fluctuations at levels in keeping with its risk strategy and profile. In pursuance of this, the BBVA Group undertakes active balance-sheet management through operations intended to optimize the levels of risk assumed against expected earnings and respect the maximum levels of accepted risk. The Asset and Liabilities Committee (ALCO) is the body that makes the decisions to act according to the proposals of the Balance-Sheet Management unit, which designs and executes the strategies to be implemented, using internal risk metrics in accordance with the corporate model.
The Corporate Risk Management (CRM) area acts as an independent unit responsible for monitoring and analyzing risks, standardizing risk management metrics and providing tools that can anticipate potential deviations from targets. In addition, it monitors the level of compliance with the risk limits established by the Executive Committee, reporting regularly to the Risk Management Committee (RMC), the Board's Risk Committee and the Executive Committee, in particular in case of significant levels of risk assumed, in accordance with current corporate policy.
The interest-rate risk metrics designed by the CRM area periodically quantify the impact that a variation of 100 basis points in market interest rates would have on the BBVA Group’s net interest income and economic value (see Glossary). This is complemented with metrics in probabilistic terms; "economic capital" (maximum estimated loss in economic value) and the "risk margin" (the maximum estimated loss in net interest income). In all cases, the metrics are calculated as originated by the structural interest-rate risk of banking activity (excluding trading floor activity), based on simulation models of interest-rate curves. With the same frequency, the Group performs stress tests and scenario analyses to complement its assessment of its interest-rate risk profile.
The BBVA Group's corporate risk model allows hypotheses to be established on the behavior of certain products, particularly those without explicit or contractual expiry. These assumptions are based on studies that calculate the relationship between the return on these products and market rates. They enable specific balances to be disaggregated into "trend-based" (long-term) and "seasonal or volatile" (short-term residual maturity) balances.
In 2013, the weakness of the economic recovery, together with the fiscal adjustments and risks of deflation, have maintained interest rates in Europe and the U.S. at all-time lows. At the same time, the growth of emerging markets has slowed as a result of the fall in commodity prices and tougher financing conditions, leading to more expansive policies by central banks. In this interest-rate situation, the BBVA Group's structural interest-rate risk has remained under control, within the limits established by the Executive Committee. The current levels of the euro and US dollar, which are exceptionally low, also constitute a barrier to the Group's exposure, which has a favorable position with respect to rises in market rates.
Below are the average interest-rate risk exposure levels in terms of sensitivity of the main geographical areas of the BBVA Group in 2013:
Download Excel
|
|
Impact on Net Interest Income (*) | Impact on Economic Value (**) | ||
|---|---|---|---|---|
| Sensitivity to interest-rate analysis - December 2013 |
100 Basis-Point Increase | 100 Basis-Point Decrease | 100 Basis-Point Increase | 100 Basis-Point Decrease |
| Europe | 6.41% | (7.80)% | 1.58% | (1.92)% |
| Mexico | 2.27% | (2.27)% | (1.39)% | 1.59% |
| The United States | 6.27% | (8.11)% | 1.60% | (6.51)% |
| South America | 1.53% | (1.39)% | (2.93)% | 3.01% |
| BBVA Group | 3.42% | (3.90)% | 0.80% | (1.66)% |
Structural currency risk
Structural currency risk is basically caused by exposure to variations in foreign-currency exchange rates that arise in the BBVA Group’s foreign subsidiaries and foreign branches financed in a different currency to that of the investment.
Structural exchange-rate risk management in BBVA aims to minimize the potential negative impact from fluctuations in exchange rates on the capital ratios and on the contribution to earnings of international investments maintained on a long-term basis by the Group.
The Asset and Liabilities Committee (ALCO) is the body that makes the decisions to act according to the proposals of the Balance-Sheet Management unit, which designs and executes the strategies to be implemented, using internal risk metrics in accordance with the corporate model.
The Corporate Risk Management (CRM) area acts as an independent unit responsible for monitoring and analyzing risks, standardizing risk management metrics and providing tools that can anticipate potential deviations from targets. In addition, it monitors the level of compliance with the risk limits established by the Executive Committee, reporting regularly to the Risk Management Committee (RMC), the Board's Risk Committee and the Executive Committee, in particular in case of significant levels of risk assumed, in accordance with current corporate policy.
The corporate measurement model is based on the simulation of exchange-rate scenarios, using their historical change and evaluating impacts in three core management areas: capital ratio, equity and the Group's income statement. The risk mitigation measures aimed at reducing exchange-rate risk exposures are considered in calculating risk estimates. The diversification resulting from investment in different geographical areas is also taken into account. In addition, in order to complement the metrics in the three core management areas, the risk measurements are complemented with analyses of scenarios, stress testing and backtesting, thus giving a more complete overview of the Group’s exposure.
In 2013, in an environment characterized by uncertainty and volatility in currency markets, the risk mitigation level of the carrying value of the BBVA Group's holdings in foreign currency remained at 39%. The estimated exposure coverage of 2013 earnings in foreign currency has been 43%.
In 2013, the average asset exposure sensitivity to a 1% depreciation in exchange rates against the euro in the main currencies to which BBVA is exposed stood at €200 million, with 34% in the Mexican peso, 26% in South American currencies, 23% in Asian and Turkish currencies, and 15% in the US dollar.
Structural equity risk
The BBVA Group's exposure to structural equity risk is basically derived from investments in industrial and financial companies with medium- and long-term investment horizons. This exposure is mitigated through net short positions held in derivatives of their underlying assets, used to limit portfolio sensitivity to potential falls in prices.
The Corporate Risk Management (CRM) area acts as an independent unit responsible for monitoring and analyzing risks, standardizing risk management metrics and providing tools that can anticipate potential deviations from targets. In addition, it monitors the level of compliance with the risk limits established by the Executive Committee, reporting regularly to the Risk Management Committee (RMC), the Board's Risk Committee and the Executive Committee, in particular in case of significant levels of risk assumed, in accordance with current corporate policy.
The structural equity risk metrics designed by CRM according to the corporate model contribute to the effective monitoring of risk by estimating the sensitivity figures and the capital necessary to cover possible unexpected losses due to variations in the value of the companies making up the Group’s equity portfolio, at a confidence level that corresponds to the institution’s target rating, and taking into account the liquidity of the positions and the statistical performance of the assets under consideration. These figures are supplemented by periodic stress tests, backtesting and scenario analyses.
The aggregate sensitivity of the BBVA Group's consolidated equity to a 1% fall in the price of shares stood at €31 million as of December 31, 2013, and the sensitivity of pre-tax profit is estimated at €1 million. These figures are estimated taking into account the exposure in shares valued at market prices, or if not applicable, at fair value (except for the positions in the Treasury Area portfolios) and the net delta-equivalent positions in options on their underlyings.
7.3 Liquidity risk
The aim of liquidity risk management, tracking and control is to ensure, in the short term, that the payment commitments of the BBVA Group entities can be duly met without having to resort to borrowing funds under burdensome terms, or damaging the image and reputation of the entities. In the medium term the aim is to ensure that the Group’s financing structure is ideal and that it is moving in the right direction with respect to the economic situation, the markets and regulatory changes.
Management of liquidity and structural finance within the BBVA Group is based on the principle of the financial autonomy of the entities that make it up. This approach helps prevent and limit liquidity risk by reducing the Group’s vulnerability in periods of high risk. This decentralized management avoids possible contagion due to a crisis that could affect only one or various BBVA Group entities, which must cover their liquidity needs independently in the markets where they operate. Liquidity Management Units have been set up for this reason in the geographical areas where the main foreign subsidiaries operate, and also for the parent BBVA S.A.
Thus a core principle of the BBVA Group’s liquidity management is the financial independence of its banking subsidiaries. This aims to ensure that the cost of liquidity is correctly reflected in price formation. Accordingly, a liquidity pool is maintained at an individual entity level, both in Banco Bilbao Vizcaya Argentaria, S.A. and in the banking subsidiaries, including BBVA Compass, BBVA Bancomer and the Latin American subsidiaries. The only exception to this principle is Banco Bilbao Vizcaya Argentaria (Portugal), S.A., which is funded by Banco Bilbao Vizcaya Argentaria, S.A. Banco Bilbao Vizcaya Argentaria (Portugal), S.A. accounted for 0.91% of total consolidated assets and 0.56% of total consolidated liabilities as of December 31, 2013.
The Group's main source of funds is the customer deposit base, which consists primarily of demand, savings and time deposit accounts. In addition to relying on customer deposits, the Group also accesses the interbank market (overnight and time deposits) and domestic and international capital markets for our additional liquidity requirements. To access the capital markets, a series of domestic and international programs are in place for the issuance of commercial paper and medium- and long-term debt. A diversified liquidity pool of liquid assets and securitized assets are also generally maintained an individual entity level. Another source of liquidity is generation of cash flow from operations. Finally, funding requirements are supplemented with borrowings from the Bank of Spain and the European Central Bank (ECB) or the respective central banks of the countries where the subsidiaries are located.
The table below shows the types and amounts of instruments included in the liquidity pool of the most significant units:
Download Excel
| 2013 | Millions of Euros | |||
|---|---|---|---|---|
| BBVA Eurozone (1) | BBVA Bancomer | BBVA Compass | Others | |
| Cash and balances with central banks | 10,826 | 6,159 | 1,952 | 6,843 |
| Assets for credit operations with central banks | 32,261 | 3,058 | 9,810 | 7,688 |
| Central governments issues | 16,500 | 229 | 904 | 7,199 |
| Of Which: Spanish government securities | 14,341 | - | - | - |
| Other issues | 15,761 | 2,829 | 2,224 | 489 |
| Loans | - | - | 6,682 | - |
| Other non-eligible liquid assets | 4,735 | 425 | 278 | 396 |
| ACCUMULATED AVAILABLE BALANCE | 47,822 | 9,642 | 12,040 | 14,927 |
The Asset and Liabilities Committee (ALCO) is the body that makes the decisions to act according to the proposals of the Balance-Sheet Management unit, which designs and executes the strategies to be implemented, using internal risk metrics in accordance with the corporate model. Both the evaluation and execution of actions in each of the Liquidity Management Units are carried out by ALCO and the management unit corresponding to these Liquidity Management Units.
The Corporate Risk Management (CRM) area acts as an independent unit responsible for monitoring and analyzing risks, standardizing risk management metrics and providing tools that can anticipate potential deviations from targets. In addition, it monitors the level of compliance with the risk limits established by the Executive Committee, reporting regularly to the Risk Management Committee (RMC), the Board's Risk Committee and the Executive Committee, in particular in case of significant levels of risk assumed, in accordance with current corporate policy.
The liquidity and funding risk metrics designed by CRM maintain an adequate risk profile for the BBVA Group's Liquidity and Funding Risk Appetite Framework, in accordance with the retail model on which its business activity is based. The objectives included in the decision-making process for managing liquidity and funding risk are specified for this purpose. Among the metrics, the loan-to-stable-customer-deposit ratio is one of the core management tools. It ensures that there are adequate levels of self-funding for lending on the balance sheet at all times. Once the levels of self-funding of the balance sheet have been established, the second core element is the correct diversification of the structure of wholesale funding, to avoid the excessive dependence on short-term funding. In addition, the internal metrics promote the short-term resistance of the liquidity risk profile, guaranteeing that each Liquidity Management Unit has sufficient collateral to face the risk of an unexpected change in the behavior of markets or wholesale counterparties that prevents access to funding or forces access at unreasonable prices.
In addition, the stress analyses are a fundamental element in the scheme of tracking liquidity risk and funding, as they anticipate deviations from the liquidity targets and limits established by the Risk Appetite Framework. They also play a key role in the design of the Liquidity Contingency Plan and in defining the measures for action that would be adopted to realign the risk profile should this be necessary. The stress scenarios cover a whole range of events and levels of severity, with the aim of revealing the vulnerability of the funding structure in the event of a comprehensive test on the whole of the balance sheet.
These stress results carried out regularly by CRM reveal that BBVA has a sufficient buffer of liquid assets to face the estimated liquidity shocks in a scenario such as a combination of a systemic crisis and an internal crisis with a major downgrade in the entity's rating (up to three notches).
In 2013, one of the most significant aspects has been a steady improvement in the stability of the wholesale funding markets in Europe as a result of the positive trend in sovereign risk premiums, in an environment of improving growth expectations for the Eurozone and high market liquidity. In this context, BBVA has managed to strengthen its liquidity position and improve its funding structure based on the growth of self-funding from stable customer funds.
With respect to the new regulatory framework, the BBVA Group has continued to develop an orderly plan to adapt to the regulatory ratios so as to allow it to adopt best practices and the most effective and strict criteria for their implementation sufficiently in advance. In January 2013 some of the aspects of the document published by the Banking Supervisory Committee published in December 2010 on the Liquidity Coverage Ratio (LCR) were updated and made more flexible. They include incorporating the ratio as a regulatory requirement on January 1, 2015, with a 60% demand for compliance, to be increased to 100% by January 2019.
In addition, the Bank Supervisory Committee has initiated once more the review of the “Net Stable Funding Ratio” (NSFR), which aims to increase the weight of medium- and long-term funding on the banks' balance sheets. It will be under review until mid-2016 and become a regulatory requirement starting on January 1, 2018.
The BBVA Group has continued to develop a plan to adapt to the regulatory ratios so as to allow it to adopt best practices and the most effective and strict criteria for their implementation sufficiently in advance.
7.4 Residual maturity
Below is a breakdown by contractual maturity of the balances of certain headings in the accompanying consolidated balance sheets, excluding any valuation adjustments or impairment losses:
Download Excel
| Contractual Maturities 2013 |
Millions of Euros | ||||||
|---|---|---|---|---|---|---|---|
| Demand | Up to 1 Month | 1 to 3 Months | 3 to 12 Months | 1 to 5 Years | Over 5 years | Total | |
| Asset - |
|
|
|
|
|
|
|
| Cash and balances with central banks | 30,851 | 2,200 | 706 | 734 | 396 | - | 34,887 |
| Loans and advances to credit institutions | 3,641 | 11,474 | 2,637 | 1,552 | 2,389 | 1,098 | 22,791 |
| Loans and advances to customers | 27,428 | 26,551 | 19,930 | 43,295 | 87,828 | 131,833 | 336,865 |
| Debt securities | 146 | 2,991 | 1,944 | 14,793 | 45,846 | 40,463 | 106,183 |
| Derivatives (trading and hedging) | - | 1,081 | 1,435 | 3,589 | 12,705 | 21,359 | 40,169 |
| Total | 62,066 | 44,297 | 26,652 | 63,963 | 149,164 | 194,753 | 540,895 |
| Liabilities - |
|
|
|
|
|
|
|
| Deposits from central banks | 82 | 13,722 | 1,350 | 1,015 | 14,525 | - | 30,694 |
| Deposits from credit institutions | 3,314 | 22,796 | 8,911 | 5,570 | 8,897 | 2,766 | 52,254 |
| Deposits from customers | 140,846 | 55,418 | 14,692 | 44,575 | 33,080 | 10,994 | 299,605 |
| Debt certificates (including bonds) | - | 4,039 | 383 | 9,901 | 35,581 | 12,640 | 62,544 |
| Subordinated liabilities | - | 38 | 1 | 993 | 1,389 | 7,847 | 10,268 |
| Other financial liabilities | 316 | 4,253 | 404 | 297 | 367 | 21 | 5,658 |
| Short positions | 7,528 | - | - | - | - | - | 7,528 |
| Derivatives (trading and hedging) | - | 904 | 1,448 | 3,749 | 12,778 | 21,032 | 39,912 |
| Total | 152,086 | 101,170 | 27,189 | 66,100 | 106,617 | 55,300 | 508,463 |
| Contingent Liabilities | - | - | - | - | - | - | - |
| Financial guarantees | 751 | 1,455 | 212 | 1,561 | 3,059 | 432 | 7,471 |
Download Excel
| Contractual Maturities 2012 |
Millions of Euros | ||||||
|---|---|---|---|---|---|---|---|
| Demand | Up to 1 Month | 1 to 3 Months | 3 to 12 Months | 1 to 5 Years | Over 5 years | Total | |
| Asset - |
|
|
|
|
|
|
|
| Cash and balances with central banks | 31,488 | 2,514 | 605 | 364 | 505 | - | 35,477 |
| Loans and advances to credit institutions | 3,351 | 14,459 | 1,479 | 1,732 | 3,367 | 984 | 25,372 |
| Loans and advances to customers | 23,005 | 33,029 | 22,157 | 41,892 | 92,784 | 142,352 | 355,218 |
| Debt securities | 198 | 3,243 | 4,464 | 11,156 | 46,217 | 40,024 | 105,301 |
| Derivatives (trading and hedging) | - | 1,318 | 1,361 | 3,765 | 15,655 | 31,444 | 53,544 |
| Total | 58,041 | 54,563 | 30,066 | 58,910 | 158,529 | 214,804 | 574,912 |
| Liabilities - |
|
|
|
|
|
|
|
| Deposits from central banks | 18 | 8,095 | 3,232 | - | 34,495 | 350 | 46,190 |
| Deposits from credit institutions | 3,839 | 29,488 | 2,136 | 7,137 | 8,937 | 3,909 | 55,446 |
| Deposits from customers | 136,039 | 45,859 | 14,758 | 50,202 | 26,578 | 8,251 | 281,687 |
| Debt certificates (including bonds) | - | 6,065 | 4,115 | 17,991 | 38,966 | 14,787 | 81,924 |
| Subordinated liabilities | - | 50 | - | 724 | 3,242 | 7,090 | 11,106 |
| Other financial liabilities | 4,263 | 1,813 | 383 | 253 | 844 | 34 | 7,590 |
| Short positions | 6,580 | - | - | - | - | - | 6,580 |
| Derivatives (trading and hedging) | - | 1,085 | 1,260 | 3,804 | 15,314 | 30,759 | 52,222 |
| Total | 150,739 | 92,455 | 25,884 | 80,111 | 128,377 | 65,179 | 542,744 |
Download Excel
| Contractual Maturities 2011 |
Millions of Euros | ||||||
|---|---|---|---|---|---|---|---|
| Demand | Up to 1 Month | 1 to 3 Months | 3 to 12 Months | 1 to 5 Years | Over 5 years | Total | |
| Asset - |
|
|
|
|
|
|
|
| Cash and balances with central banks | 27,070 | 1,393 | 636 | 319 | 411 | - | 29,829 |
| Loans and advances to credit institutions | 2,599 | 7,083 | 1,307 | 3,492 | 7,137 | 2,783 | 24,401 |
| Loans and advances to customers | 17,539 | 37,705 | 22,276 | 44,594 | 90,649 | 137,476 | 350,239 |
| Debt securities | 806 | 2,199 | 2,643 | 7,684 | 37,919 | 32,744 | 83,995 |
| Derivatives (trading and hedging) | - | 1,795 | 1,873 | 4,694 | 16,200 | 27,310 | 51,872 |
| Total | 48,014 | 50,175 | 28,735 | 60,783 | 152,316 | 200,313 | 540,336 |
| Liabilities - |
|
|
|
|
|
|
|
| Deposits from central banks | 3 | 19,305 | 2,609 | - | 10,950 | 1 | 32,868 |
| Deposits from credit institutions | 2,101 | 26,009 | 4,173 | 5,315 | 15,228 | 3,500 | 56,326 |
| Deposits from customers | 112,877 | 67,324 | 16,521 | 39,964 | 27,957 | 6,624 | 271,267 |
| Debt certificates (including bonds) | - | 2,012 | 1,861 | 11,246 | 45,440 | 16,971 | 77,530 |
| Subordinated liabilities | - | - | 109 | 37 | 4,856 | 9,427 | 14,429 |
| Other financial liabilities | 4,667 | 1,194 | 330 | 456 | 1,167 | 1,217 | 9,031 |
| Short positions | 4,611 | - | - | - | - | - | 4,611 |
| Derivatives (trading and hedging) | - | 1,683 | 1,632 | 5,219 | 15,494 | 25,249 | 49,277 |
| Total | 124,259 | 117,527 | 27,235 | 62,237 | 121,092 | 62,989 | 515,339 |