Non Core Real Estate
Highlights
- Continued positive trend in the Spanish real-estate market, although with a more moderate growth rate.
- The operation with Cerberus closed in October, which reduces net real-estate exposure almost entirely.
- Significant reduction in losses in the area.
Industry trends
The macroeconomic context continues to be favorable for the real-estate sector: among other factors, the economy is still generating jobs, household incomes continue to grow, consumer confidence is at relatively high levels, and demand among foreigners for homes remains buoyant. All this is in a context of low interest rates:
- After the significant increase in investment in housing in the first quarter of 2018, growth moderated in the second quarter. Despite this, in the first half of the year, investment in housing grew by a quarterly average of 1.6%, above the average growth of the economy, according to data from the National Quarterly Accounting Office of the INE.
- From January to August, 384,246 homes were sold in Spain, a year-on-year increase of 9.9%, according to information from the General Council of Spanish Notaries (CIEN).
- Housing prices accelerated in the second quarter of 2018 to 6.8% in year-on-year terms (INE figures).
- The interest rate applied to new loan operations was around 2.3% and the cost of mortgage financing remains at relatively low levels. As a result, new home loans grew by 16.9% in the first eight months of the year.
- Finally, construction activity continued to grow, in response to the increase in residential demand. According to data from the Ministry of Public Works, nearly 62,100 new housing construction permits were approved in the first seven months of the year, up 26.1% on the same period in 2017.
Activity
The decrease in the net real-estate exposure since the closing of 2017 was 14.9% and the net real-estate exposure amounted to €5,460m as of 30-September-2018.
With regards to the loans to developers, an agreement about the sale of a portfolio of non-performing and written-off loans to developers with a gross amount of approximately €1 billion was closed with the Canada Pension Plan Investment Board (CPPIB).
Having received the regulatory authorizations, BBVA closed on October 10, 2018 the operation of the transfer of its real-estate business in Spain to Cerberus Capital Management, L.P. The closing of this operation implies the sale of 80% of the share capital of Divarian, the joint venture to which the real-estate business had been transferred, to Cerberus even though the effective transfer of some real estate owned assets (“REOs”) is subject to the fulfillment of certain conditions and in the meanwhile, BBVA will continue to manage those assets. BBVA will hold the remaining 20% of the share capital of Divarian. BBVA estimates that this operation will not have a significant impact neither on the attributable profit of BBVA Group nor on the capital ratio CET1 fully-loaded.
The transfer includes both the real-estate assets and the necessary employees to manage this business. The transfer of some real-estate assets is subject to the fulfillment of certain conditions which are usual in this type of operations, as it was disclosed in the Relevant Event regarding the announcement of the agreement, and is the reason why the final sale’s price will be adjusted according to the assets that finally will be transferred.
In addition, BBVA reached an agreement with Blackstone for the sale of its participation of its 25.24% stake in Testa for €478m. This operation, once the pending authorizations are received, represents a new milestone in the reduction of BBVA’s real-estate exposure.
Evolution of Net exposure to real estate
(Millions of Euros)
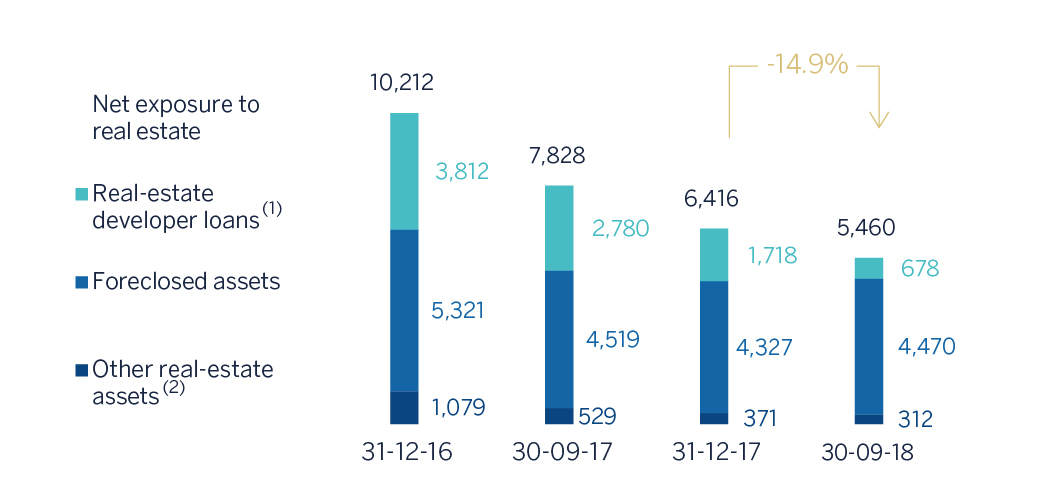
- (1) Compared to Bank of Spain's Transparency scope (Circular 5/2011 dated November 30), real-estate developer loans do not include €2.3Bn (September 2018) mainly related performing loans to developers transferred to the Banking Activity in Spain area.
- (2) Other real-estate assets not originated from foreclosures.
Coverage of real-estate exposure (Millions of Euros as of 30-09-2018)
| Gross Value | Provisions | Net exposure | % Coverage | |
|---|---|---|---|---|
| Real-estate developer loans (1) | 1,436 | 758 | 678 | 53 |
| Performing | 247 | 32 | 215 | 13 |
| Finished properties | 177 | 24 | 153 | 14 |
| Construction in progress | 24 | 4 | 20 | 17 |
| Land | 43 | 3 | 40 | 8 |
| Without collateral and other | 3 | 1 | 2 | 23 |
| NPL | 1,189 | 725 | 464 | 61 |
| Finished properties | 432 | 216 | 216 | 50 |
| Construction in progress | 50 | 18 | 32 | 36 |
| Land | 597 | 406 | 190 | 68 |
| Without collateral and other | 110 | 85 | 26 | 77 |
| Foreclosed assets | 11,568 | 7,098 | 4,470 | 61 |
| Finished properties | 7,169 | 3,659 | 3,510 | 51 |
| Construction in progress | 519 | 345 | 174 | 66 |
| Land | 3,880 | 3,094 | 786 | 80 |
| Other real-estate assets (2) | 814 | 503 | 312 | 62 |
| Real-estate exposure | 13,818 | 8,358 | 5,460 | 60 |
- (1) Compared to Bank of Spain's Transparency scope (Circular 5/2011 dated November 30), real-estate developer loans do not include €2.3 Bn (September 2018) mainly related performing loans to developers transferred to the Banking activity in Spain area.
- (2) Other real-estate assets not originated from foreclosures.
Total real-estate exposure, including loans to developers, foreclosures and other assets, had a coverage ratio of 60% at the close of September 2018. The coverage ratio of foreclosed assets stood at 61%.
Non-performing loan balances fell again, thanks to a lower number of new additions to NPLs and the recovery of activity over the quarter. The NPL coverage ratio was maintained at 61%.
Results
This business area posted a cumulative loss for the period between January and September of 2018 of €60m, which represents a positive evolution compared to a loss of €274m in the same period the previous year.
Financial statements (Millions of Euros)
| IFRS 9 | IAS 39 | |||||
|---|---|---|---|---|---|---|
| Income statement | Jan.-Sep. 18 | ∆% | Jan.-Sep. 17 | |||
| Net interest income | 32 | (34.4) | 48 | |||
| Net fees and commissions | 3 | (0.3) | 3 | |||
| Net trading income | 6 | n.s. | (0) | |||
| Other operating income and expenses | (51) | (26.1) | (69) | |||
| Gross income | (11) | (38.5) | (18) | |||
| Operating expenses | (58) | (21.4) | (74) | |||
| Personnel expenses | (36) | (3.3) | (38) | |||
| Other administrative expenses | (19) | (15.5) | (22) | |||
| Depreciation | (3) | (80.4) | (14) | |||
| Operating income | (69) | (24.8) | (92) | |||
| Impairment on financial assets not measured at fair value through profit or loss | (6) | (95.2) | (126) | |||
| Provisions or reversal of provisions and other results | 0 | n.s. | (131) | |||
| Profit/(loss) before tax | (75) | (78.5) | (349) | |||
| Income tax | 15 | (80.1) | 75 | |||
| Profit/(loss) for the year | (60) | (78.1) | (274) | |||
| Non-controlling interests | (0) | n.s. | 1 | |||
| Net attributable profit | (60) | (78.0) | (274) | |||
| IFRS 9 | IAS 39 | |||||
|---|---|---|---|---|---|---|
| Balance sheet | 30-09-18 | ∆% | 31-12-17 | |||
| Cash, cash balances at central banks and other demand deposits | 15 | 26.2 | 12 | |||
| Financial assets designated at fair value | 1,316 | n.s. | 9 | |||
| of which loans and advances | 1,326 | n.s. | - | |||
| Financial assets at amortized cost | 757 | (78.5) | 3,521 | |||
| of which loans and advances | 743 | (78.9) | 3,521 | |||
| Inter-area positions | - | - | - | |||
| Tangible assets | 20 | n.s. | 0 | |||
| Other assets | 5,648 | (8.5) | 6,172 | |||
| Total assets/liabilities and equity | 7,755 | (20.2) | 9,714 | |||
| Financial liabilities held for trading and designated at fair value through profit or loss | - | - | - | |||
| Deposits from central banks and credit institutions | 37 | n.s. | 0 | |||
| Deposits from customers | 77 | n.s. | 13 | |||
| Debt certificates | 465 | (40.7) | 785 | |||
| Inter-area positions | 5,043 | (12.7) | 5,775 | |||
| Other liabilities | 271 | n.s. | - | |||
| Economic capital allocated | 1,861 | (40.7) | 3,141 | |||
| Memorandum item: | ||||||
| Risk-weighted assets | 7,475 | (22.9) | 9,692 | |||