The United States
Highlights
- Lending growth supported by consumer and business financing.
- Good performance of net interest income and provisions.
- Improvement in efficiency.
- Net attributable profit affected by the tax reform at the end of 2017.
Business activity (1)
(Year-on-year change at constant exchange rate. Data as of 30-09-2018)
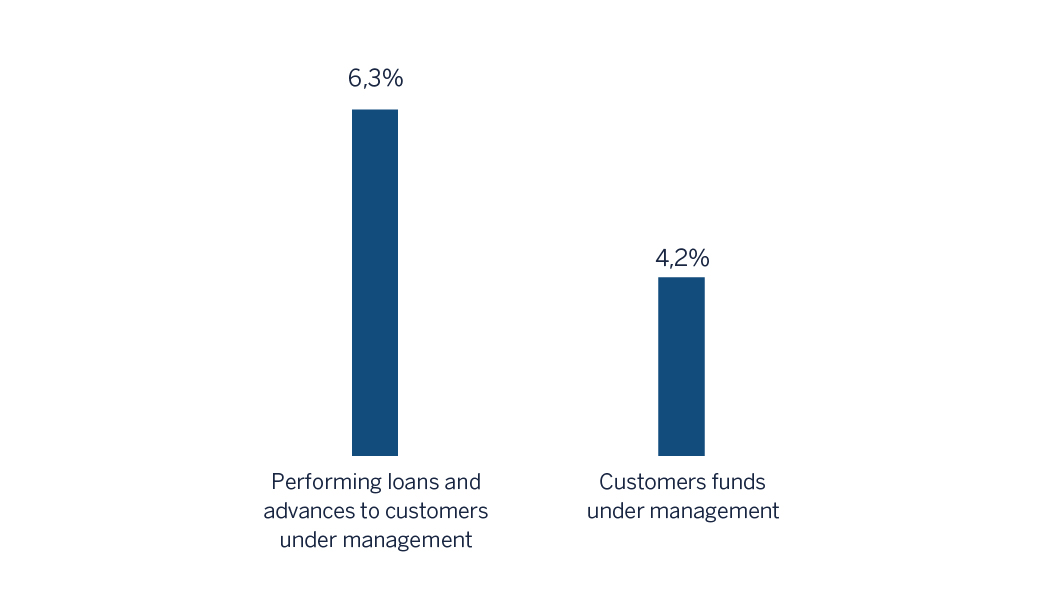
(1) Excluding repos.
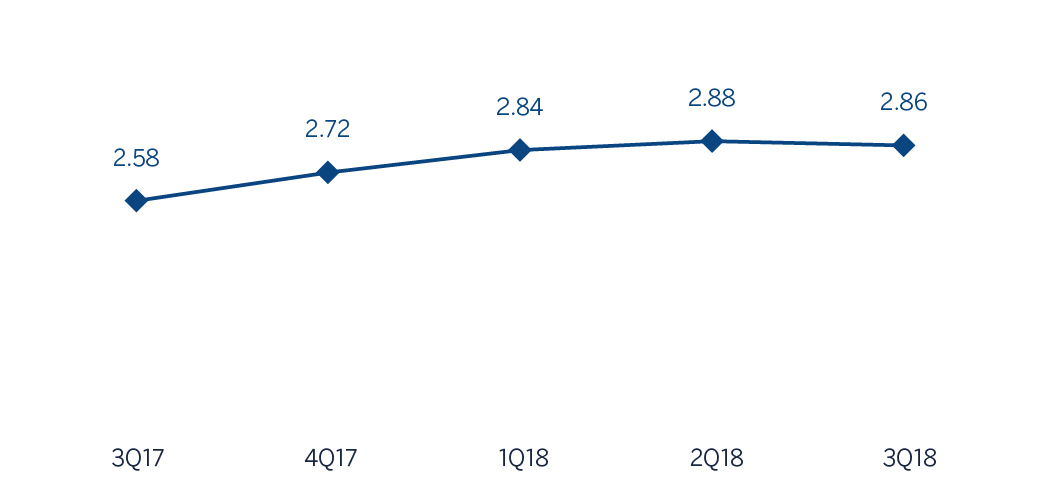
Net interest income/ATAs
(Percentage. Constant exchange rate)
Operating income
(Millions of Euros at constant exchange rate)
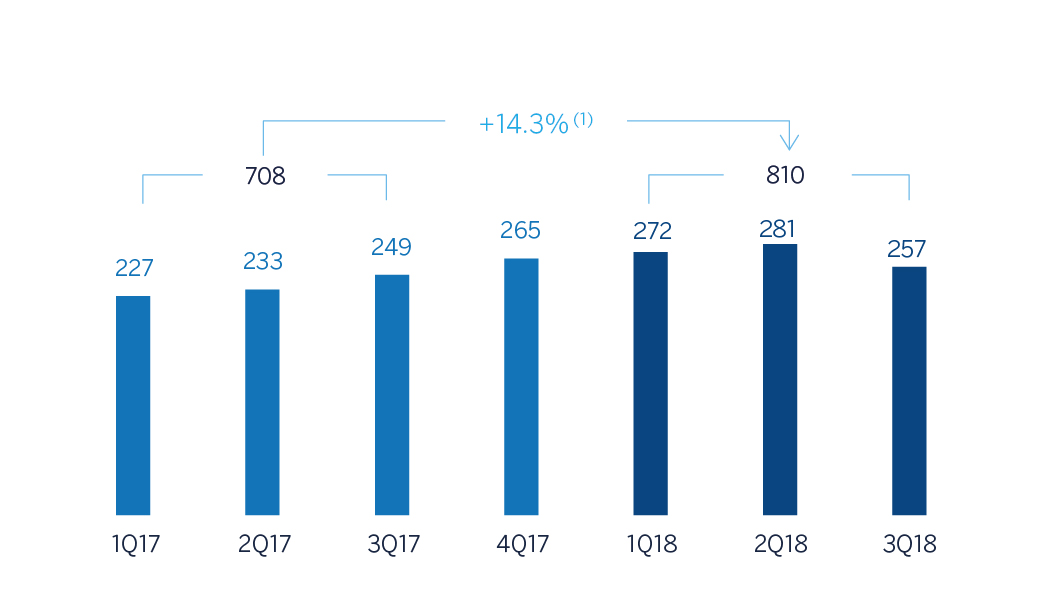
(1) At current exchange rate: 7.1%.
Net attributable profit
(Millions of Euros at constant exchange rate)
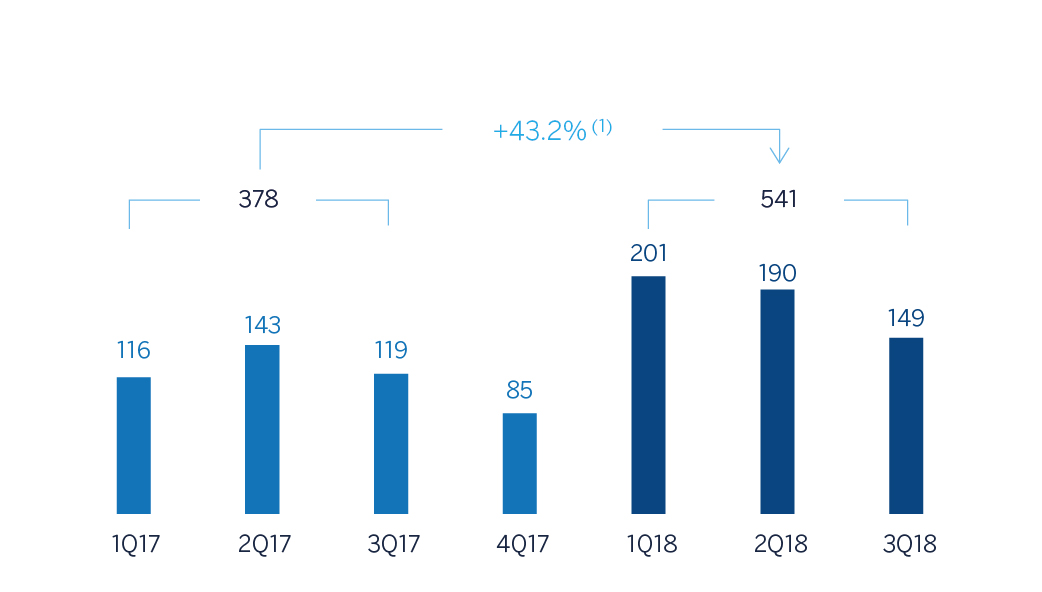
(1) At current exchange rate: 34.5%.
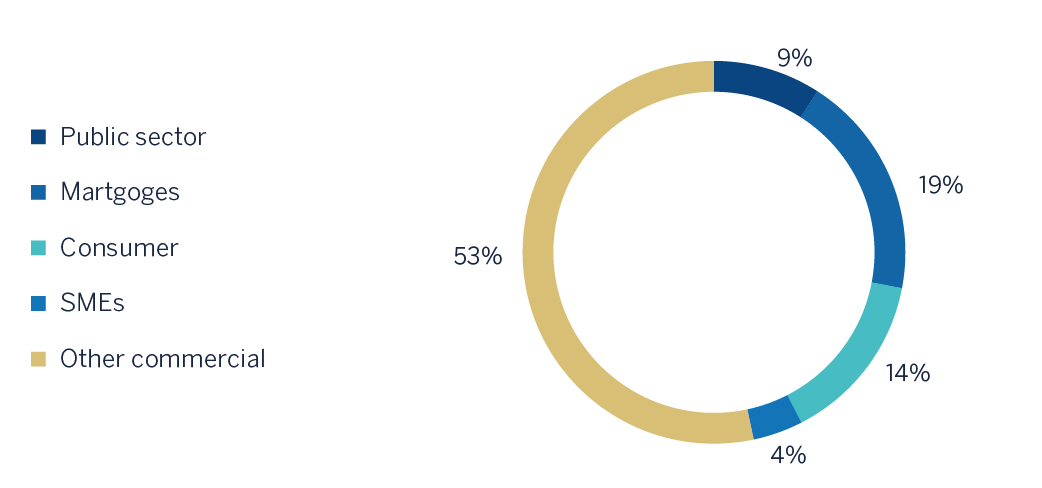
Breakdown of performing loans under management (1)
(30-09-2018)
Breakdown of customer funds under management (1)
(30-09-2018)
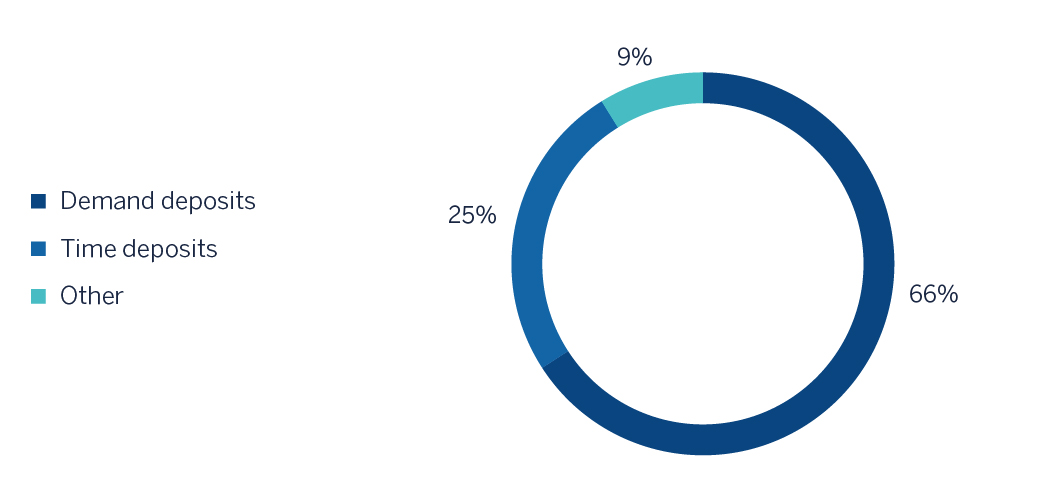
(1) Excluding repos.
(1) Excluding repos.
Macro and industry trends
According to the latest available information from the Bureau of Economic Analysis (BEA), the growth of the U.S. GDP accelerated significantly to 4.2% in annualized terms in the second quarter of 2018, offsetting the slowdown perceived at the beginning of year. This strong performance was explained by the strong increase in private consumption, both goods and services, which continued to be supported by solid fundamentals, such as the dynamism of the labor market and the higher growth of wages. In addition, external demand also contributed positively to growth, due to the strong increase in exports and the stagnation of imports. Given this context, the strength of domestic demand, partly driven by a more expansive fiscal policy, and the rebound in the price of oil, accelerated inflation to 2.7% (August data), and the Fed continued with its monetary policy normalization, with three increases of official interest rates of 25 basis points each year to date (up to the 2.00-2.25% range). It is expected to continue on this path for the remainder during this and next year.
The persistence of the expansive cycle in the country, together with the resurgence of uncertainty and financial volatility, associated with a combination of factors (among them, the fear of an escalating protectionism and a greater perception of risk on the vulnerability of emerging markets) have substantially revalued the dollar since the second quarter of 2018, which so far this year has appreciated by around 5%, with September closing data of the effective exchange rate weighted by the importance of its main trading partners.
The general situation of the country's banking system continued to be very positive. According to the latest available data from the Fed through August 2018, the total volume of bank credit in the system increased by 1.3% over the same month of the previous year, with a very similar performance in all the main portfolios. At the same time, deposits remained at the same level as the twelve prior months (up 0.1%). Lastly, non-performing loans continued their downward trend, with an NPL ratio of 1.59% at the end of the second quarter of 2018.
Activity
Unless expressly stated otherwise, all the comments below on rates of change, for both activity and earnings, will be given at constant exchange rate. These rates, together with changes at current exchange rate, can be seen in the attached tables of financial statements and relevant business indicators.
The most relevant aspects related to the area’s activity year-to-date as of 30-September-2018 were:
- Lending activity in the area (performing loans under management) continued an upward trend increasing by 4.9% year-to-date and 6.3% year-on-year.
- By portfolio, higher interest rates continued to affect negatively the mortgages and loans to developers (construction real estate). By contrast, the consumer and credit card loans, which have higher margins and are therefore more profitable, increased by 19.6% year-to-date. Both loans to SMEs (up 10.6%) and corporates (up 4.8%) also performed well.
- Risk indicators continued to be stable. The NPL ratio reduced to 1.1% and the NPL coverage ratio closed at 101%.
- Customer deposits nder management decreased 3.3% year-to-date with a flat evolution of the demand deposits (up 0.6%) and a decline in the time deposits (down 11.3%). In comparison with September 2017, an increase of 4.2% is observable, mainly due to the deposit-gathering campaigns launched in 2017, with positive contributions to low cost deposits (up 4.4% in demand deposits and up 8.9% in time deposits).
Results
The United States generated a cumulative net attributable profit of €541m during the first nine months of 2018, up 43.2% higher than the same period of last year, due mainly to the increase in net interest income, lower provisions and lower tax expenses as a result of a reduction in the effective tax rate following the tax reform approved in the last quarter of 2017. Also worth noting are the following:
- Net interest income continued to perform positively, with the cumulative figure up by 12.0% year-on-year and 2.3% over the quarter. This was due partly to the Fed's interest-rate hikes, but also the strategic measures adopted by BBVA Compass to improve loan yields (boosting consumer financing) and reduce the cost of deposits (improved deposit mix and wholesale funding).
- Net fees and commissions declined by 2.9% year-on-year, due to a lower contribution from markets, investment banking and money remittances.
- NTI was down by 6.5% year-on-year, driven by lower valuations of interest-rate derivatives, which were partially offset by favorable trading gains from bonds and exchange rates.
- Operating expenses grew by 6.2% year-on-year, mainly due to greater activity related to the growth of consumer loans. This increase is lower than that shown by the gross margin (+9.1%). As a result, the efficiency ratio improved.
- Impairment losses on financial assets fell by 25.1% in the last twelve months, due to the lower provisioning requirements in those portfolios affected by the 2017 hurricanes. As a result, the cumulative cost of risk through 30-September-2018 declined to 0.33%.
Financial statements and relevant business indicators
(Millions of Euros and percentage)
| IFRS 9 | IAS 39 | ||||
|---|---|---|---|---|---|
| Income statement | Jan.-Sep. 18 | ∆% | ∆%(1) | Jan.-Sep. 17 | |
| Net interest income | 1,665 | 4.6 | 12.0 | 1,591 | |
| Net fees and commissions | 448 | (9.0) | (2.9) | 493 | |
| Net trading income | 69 | (11.1) | (6.5) | 78 | |
| Other operating income and expenses | (0) | (99.1) | (99.0) | (23) | |
| Gross income | 2,182 | 2.0 | 9.1 | 2,139 | |
| Operating expenses | (1,373) | (0.7) | 6.2 | (1,383) | |
| Personnel expenses | (784) | (1.9) | 5.0 | (799) | |
| Other administrative expenses | (457) | 3.3 | 10.5 | (442) | |
| Depreciation | (132) | (7.1) | (0.5) | (142) | |
| Operating income | 810 | 7.1 | 14.3 | 756 | |
| Impairment on financial assets not measured at fair value through profit or loss | (138) | (30.1) | (25.1) | (197) | |
| Provisions or reversal of provisions and other results | 14 | n.s. | n.s. | (18) | |
| Profit/(loss) before tax | 686 | 26.7 | 35.0 | 541 | |
| Income tax | (145) | 4.1 | 11.1 | (139) | |
| Profit/(loss) for the year | 541 | 34.5 | 43.2 | 402 | |
| Non-controlling interests | - | - | - | - | |
| Net attributable profit | 541 | 34.5 | 43.2 | 402 | |
| IFRS 9 | IAS 39 | ||||
|---|---|---|---|---|---|
| Balance sheets | 30-09-18 | ∆% | ∆%(1) | 31-12-17 | |
| Cash, cash balances at central banks and other demand deposits | 4,389 | (38,5) | (40,7) | 7,138 | |
| Financial assets designated at fair value | 10,525 | (4.9) | (8.2) | 11,068 | |
| of which loans and advances | 175 | 212.2 | 201.4 | 56 | |
| Financial assets at amortized cost | 60,940 | 11.4 | 7.5 | 54,705 | |
| of which loans and advances to customers | 58,608 | 9.1 | 5.3 | 53,718 | |
| Inter-area positions | - | - | - | - | |
| Tangible assets | 662 | 0.6 | (2.9) | 658 | |
| Other assets | 2,383 | 8.0 | 4.3 | 2,207 | |
| Total assets/liabilities and equity | 78,898 | 4.1 | 0.5 | 75,775 | |
| Financial liabilities held for trading and designated at fair value through profit or loss | 305 | 119.3 | 111.6 | 139 | |
| Deposits from central banks and credit institutions | 4,477 | 25.1 | 20.7 | 3,580 | |
| Deposits from customers | 60,917 | 0.2 | (3.3) | 60,806 | |
| Debt certificates | 3,227 | 60.0 | 54.4 | 2,017 | |
| Inter-area positions | 1,808 | 63.0 | 57.3 | 1,110 | |
| Other liabilities | 5,060 | (6.8) | (10.1) | 5,431 | |
| Economic capital allocated | 3,103 | 15.2 | 11.2 | 2,693 | |
| Relevant business indicators | 30-09-18 | ∆% | ∆%(1) | 31-12-17 |
|---|---|---|---|---|
| Performing loans and advances to customers under management (2) | 58,729 | 8.7 | 4.9 | 54,036 |
| Non-performing loans | 679 | (2.5) | (5.9) | 696 |
| Customer deposits under management (2) | 60,913 | 0.2 | (3,3) | 60,806 |
| Off-balance sheet funds (3) | - | - | - | - |
| Risk-weighted assets | 62,728 | 6.9 | 3.2 | 58,688 |
| Efficiency ratio (%) | 62.9 | 64.4 | ||
| NPL ratio (%) | 1.1 | 1.2 | ||
| NPL coverage ratio (%) | 101 | 104 | ||
| Cost of risk (%) | 0.33 | 0.43 |
- (1) Figures at constant exchange rate.
- (2) Excluding repos.
- (3) Includes mutual funds, pension funds and other off-balance sheet funds.