South America
Highlights
- The operation of the sale of BBVA Chile closed.
- Activity in other countries grows at a good pace.
- Good performance in more recurrent revenue.
- Argentina hyperinflation adjustment.
Business activity (1)
(Year-on-year change at constant exchange rates. Data as of 30-09-2018)
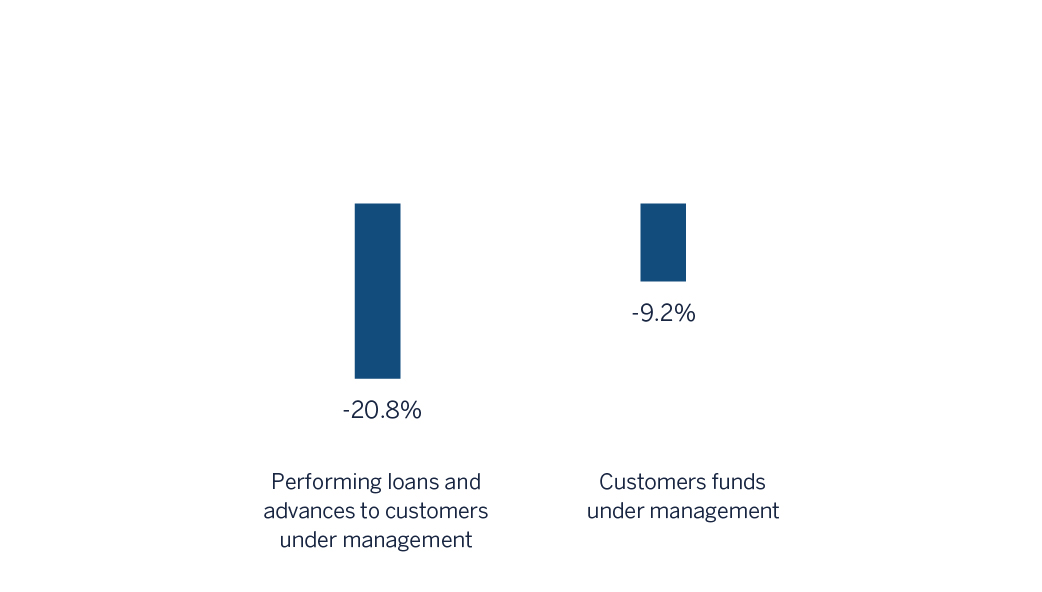
(1) Excluding repos.
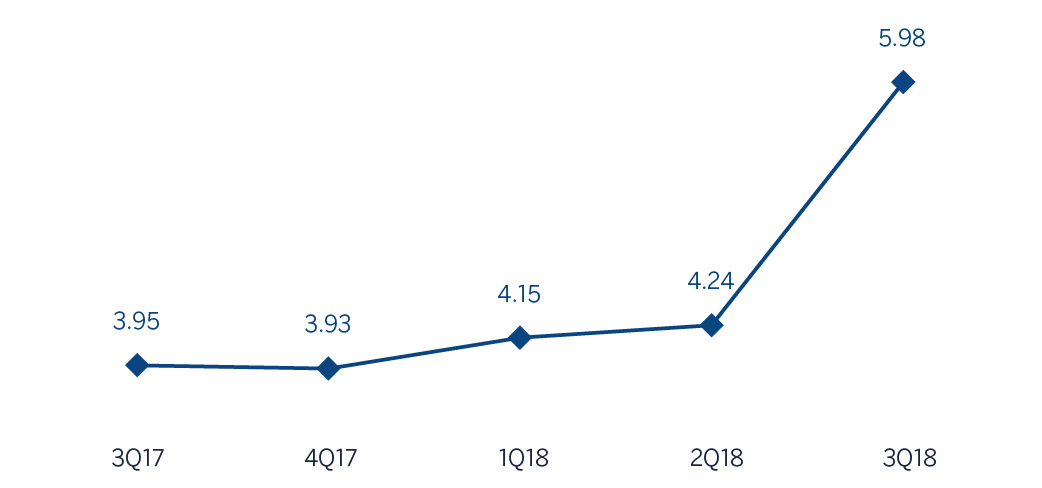
Net interest income/ATAs
(Percentage. Constant exchange rates)
Operating income
(Millions of Euros at constant exchange rates)
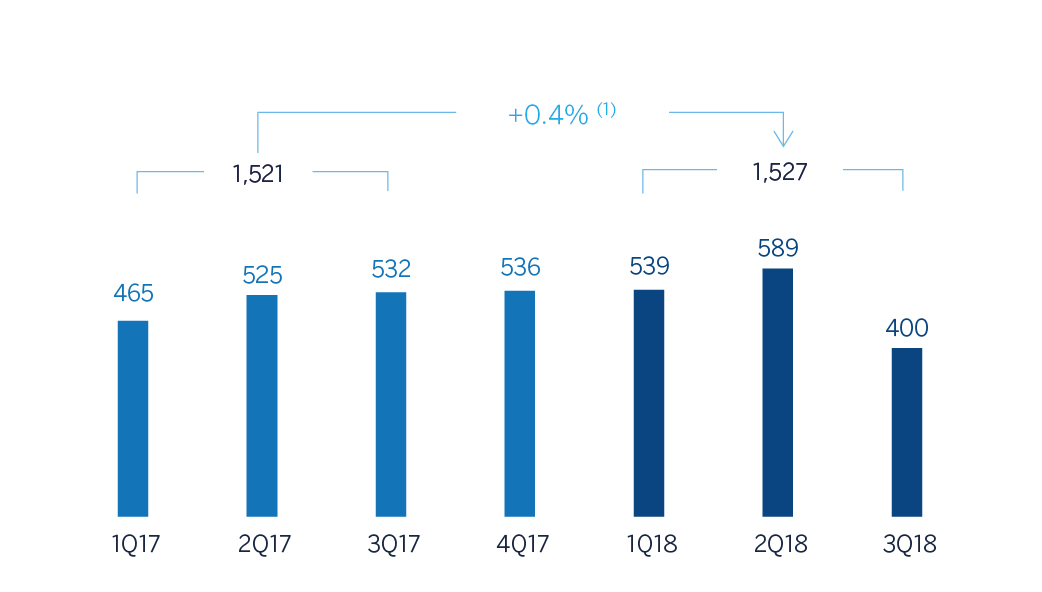
(1)At current exchange rates: -16.4%.
Net attributable profit
(Millions of Euros at constant exchange rates)
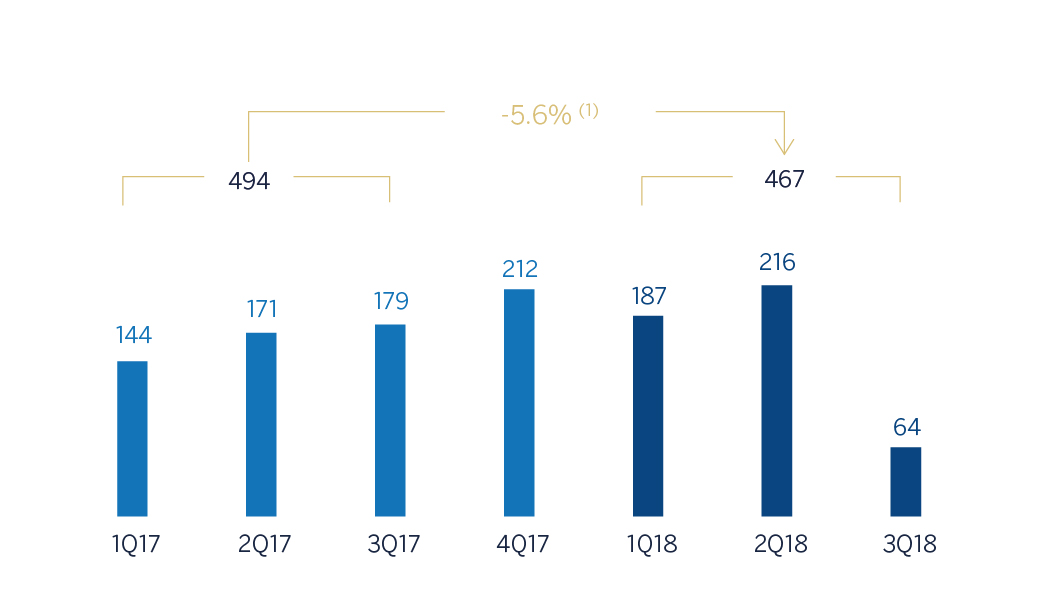
(1) At current exchange rates: -24.2%.
Breakdown of performing loans under management (1)
(30-09-2018)
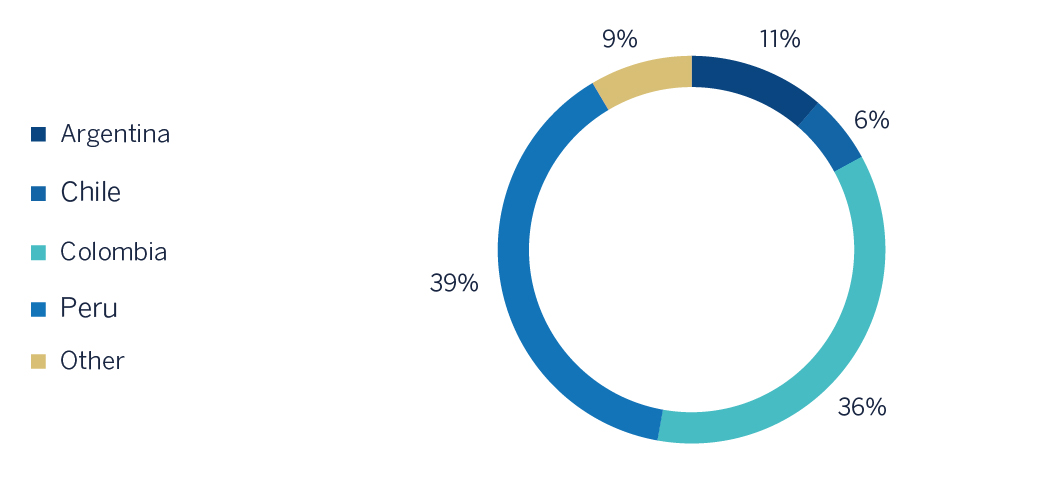
(1) Excluding repos.
Breakdown of customer funds under management (1)
(30-09-2018)
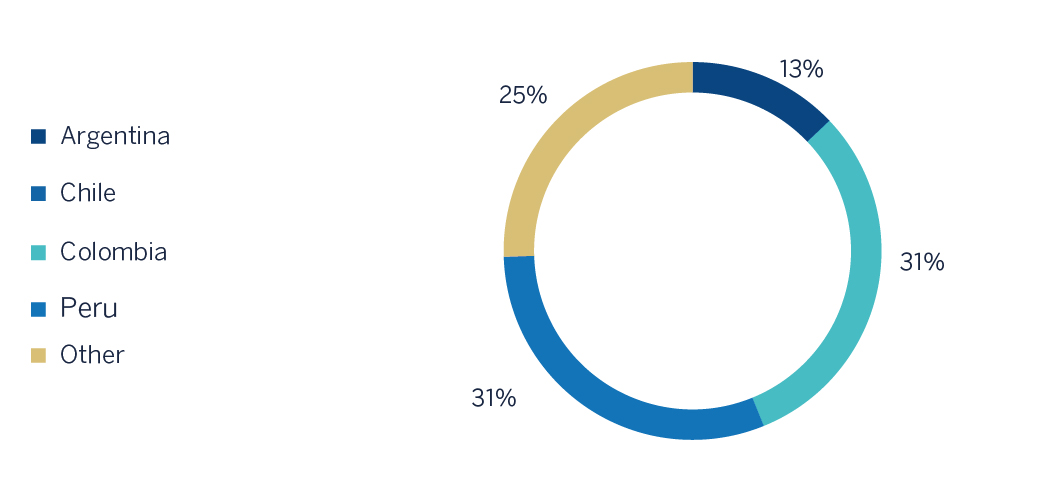
(1) Excluding repos.
Macro and industry trends
Economic activity in South America suffered on average significant fall in the second quarter of the year. However, this was the result of the strong contraction in Argentina, as the rest of the countries in the region, mainly the Andean countries, have consolidated the recovery that began in 2017. In Argentina, the lack of foreign investor confidence regarding the country's capacity to satisfy its financing needs triggered an exchange-rate crisis, with a significant impact on economic activity. The agreement reached with the IMF grants Argentina the capacity to deal with its financing needs next year and to operate on the currency markets to control the exchange rate. In the rest of the countries in the region, consumption continues to recover, supported by lower inflation levels, and also investment, boosted by growth in internal demand, the recovery of confidence and a positive external context (strong demand and commodity prices).
As in the case of economic activity, inflation in the region shows clearly two different trends: while in Argentina, and to a lesser extent Brazil, prices increased as a result of the depreciation of the currency, in the rest of the countries inflation remains at levels close to the targets of their respective central banks. To this extent, the phase of lax monetary policy could be reaching its end. In the coming months the monetary authorities could initiate steady rises in interest rates, except in the case of Argentina, which following the agreement reached with the IMF is implementing a monetary policy rule based on zero growth targets for the monetary aggregates in order to withdraw liquidity from the market and thus preventing the demand for foreign currency.
Regarding the banking systems within BBVA's regional footprint, the macroeconomic backdrop and low levels of banking penetration in these countries in aggregate terms (obviously with differences between countries) led to strong results in the main indicators of profitability and solvency, while non-performing loans remained under control. In addition, there has been sustained growth in lending and deposits.
Activity
On 6-July-2018, after obtaining all required authorizations, BBVA completed the sale to The Bank of Nova Scotia of its direct and indirect stake in Banco Bilbao Vizcaya Argentaria, Chile (BBVA Chile) as well as in other companies of its group in Chile whose operations are complementary to the banking business (particularly, BBVA Seguros Vida, S.A.). BBVA’s stake in BBVA Chile amounted to approximately 68.2% of its share capital. The impacts of this transaction will be reflected in the financial statements of the BBVA Group for the third quarter of 2018.
Unless expressly stated otherwise, all the comments below on rates of change, for both activity and earnings, will be provided at constant exchange rates, and will be impacted by the divestment in BBVA Chile. These rates, together with changes at current exchange rates, can be found in the attached tables of financial statements and relevant business indicators.
The most relevant aspects related to the area’s activity year-to-date as of 30-September-2018 were:
- Lending (performing loans under management) in South America decreased by 22.9% in the first nine months of 2018. Excluding BBVA Chile from the comparison, loans to customers grew by 6.4%. By country, the most significant increase was in Argentina (up 34.6.% year-to-date and 60.4% year-on-year) and the improvement in investment in Colombia and Peru. By portfolios, excluding BBVA Chile from the comparison, performance was especially positive in the mortgage, consumer and corporate segments.
- Regarding asset quality, there was a slight increase in the NPL ratio, as of September 30, 2018 it stood at 4.3%, while the NPL coverage ratio grew at 101%.
- Customer funds decreased by 14.6% in the first nine months of 2018 (down 11.5% year-on-year), Excluding BBVA Chile from the comparison, it grew by 9,3% in the same period (up 13.1% year-on-year). Off-balancesheet funds decreased by 2.4% year-to-date, although excluding BBVA Chile from the comparison, it grew by 9,1% in the same period. By country there was a positive trend in Argentina (up 56.2%), Colombia (up 7.4%) and Peru (up 4.8%).
Results
In the first nine months of of 2018, South America generated a net attributable profit of €467 million, which represents year-on-year fall of -5.6% (-24.2% at current exchange rates). This evolution is affected by the negative impact of accounting for hyperinflation in Argentina in the net attributable profit of the area (€-190 million) as well as by the change in the perimeter originated from the sale of BBVA Chile on July 6, 2018. However, the most recurrent income (net interest income and commissions) and NTI increased by 12.3% in the last twelve months. Decrease of the impairment losses on financial assets (down 0.4%) year-on-year. As a result, the cumulative cost of risk at the close of September stood at 1.45%.
By country, the trends in the first nine months of 2018 were as follows:
- In Argentina, there was year-on-year growth in gross income of 25.7%. This increase was based both on the performance of recurring revenue (boosted by higher volumes of business) and the positive performance of NTI (mainly due to exchange rates). Impairment losses on financial assets also posted a growth. As a result, there net attributable profit includes the effect of hyperinflation and stood at -€2 million.
- In Colombia, the increase in earnings was based on the good performance of net interest income (due to a positive performance in activity and customer spreads) and higher net fees and commissions, which boosted gross income (up 5.8%) above the rate of growth of operating expenses (up 5.4%). Together with the reduction of impairment losses on financial assets, this led to a year-on-year increase of 43.1% in the net attributable profit.
- In Peru, net attributable profit increased by 5.7% year-on-year, leveraged by the good performance of net interest income (increase in lending), higher net fees and commissions and a flattish decrease in impairment losses on financial assets.
Financial statements and relevant business indicators (Millions of Euros and percentage)
| IFRS 9 | IAS 39 | |||||
|---|---|---|---|---|---|---|
| Income statement | Jan.-Sep. 18 | ∆% | ∆% (1) | Jan.-Sep. 17 | ||
| Net interest income | 2,226 | (7.0) | 13.2 | 2,393 | ||
| Net fees and commissions | 455 | (14.5) | 9.9 | 532 | ||
| Net trading income | 303 | (13.6) | 9.2 | 350 | ||
| Other operating income and expenses | (207) | n.s. | n.s. | 65 | ||
| Gross income | 2,777 | (16.9) | 3.6 | 3,340 | ||
| Operating expenses | (1,249) | (17.4) | 7.9 | (1,513) | ||
| Personnel expenses | (626) | (19.9) | 5.6 | (782) | ||
| Other administrative expenses | (532) | (16.9) | 8.4 | (641) | ||
| Depreciation | (91) | 0.3 | 23.0 | (91) | ||
| Operating income | 1,527 | (16.4) | 0.4 | 1,827 | ||
| Impairment on financial assets not measured at fair value through profit or loss | (502) | (9.5) | (0.4) | (555) | ||
| Provisions or reversal of provisions and other results | (38) | (39.7) | (20.5) | (63) | ||
| Profit/(loss) before tax | 987 | (18.4) | 1.8 | 1,209 | ||
| Income tax | (339) | (2.4) | 24.4 | (347) | ||
| Profit/(loss) for the year | 648 | (24.8) | (7.0) | 862 | ||
| Non-controlling interests | (181) | (26.5) | (10.5) | (246) | ||
| Net attributable profit | 467 | (24.2) | (5.6) | 616 | ||
| IFRS 9 | IAS 39 | |||||
|---|---|---|---|---|---|---|
| Balance sheets | 30-09-18 | ∆% | ∆%(1) | 31-12-17 | ||
| Cash, cash balances at central banks and other demand deposits | 7,211 | (20.2) | (12.0) | 9,039 | ||
| Financial assets designated at fair value | 6,583 | (43.4) | (40.1) | 11,627 | ||
| of which loans and advances | 648 | n.s. | n.s. | 3 | ||
| Financial assets at amortized cost | 36,502 | (28.7) | (24.0) | 51,207 | ||
| of which loans and advances to customers | 34,795 | (27.9) | (23.3) | 48,272 | ||
| Tangible assets | 723 | (0.3) | 17.2 | 725 | ||
| Other assets | 54 | (97.3) | (97.2) | 2,038 | ||
| Total assets/liabilities and equity | 51,073 | (31.6) | (26.8) | 74,636 | ||
| Financial liabilities held for trading and designated at fair value through profit or loss | 567 | (79.9) | (79.3) | 2,823 | ||
| Deposits from central banks and credit institutions | 2,989 | (60.4) | (60.1) | 7,552 | ||
| Deposits from customers | 36,405 | (20.3) | (14.0) | 45,666 | ||
| Debt certificates | 3,077 | (57.3) | (56.4) | 7,209 | ||
| Other liabilities | 5,669 | (33.3) | (24.7) | 8,505 | ||
| Economic capital allocated | 2,367 | (17.8) | (9.9) | 2,881 | ||
| Relevant business indicators | 30-09-18 | ∆% | ∆%(1) | 31-12-17 |
|---|---|---|---|---|
| Performing loans and advances to customers under management (2) | 34,838 | (27.5) | (22.9) | 48,068 |
| Non-performing loans | 1,729 | (8.3) | (7.9) | 1,884 |
| Customer deposits under management (3) | 36,433 | (20.7) | (14.6) | 45,970 |
| Off-balance sheet funds (4) | 11,542 | (5.4) | (2.5) | 12,197 |
| Risk-weighted assets | 41,554 | (25.8) | (19.0) | 55,975 |
| Efficiency ratio (%) | 45.0 | 45.1 | ||
| NPL ratio (%) | 4.3 | 3.4 | ||
| NPL coverage ratio (%) | 101 | 89 | ||
| Cost of risk (%) | 1.45 | 1.32 |
- (1) Figures at constant exchange rates.
- (2) Excluding repos.
- (3) Excluding repos and including specific marketable debt securities.
- (4) Includes mutual funds, pension funds and other off-balance sheet funds.
South America. Data per country (Millions of Euros)
| IFRS 9 | IAS 39 | IFRS 9 | IAS 39 | |||||
|---|---|---|---|---|---|---|---|---|
| Operating income | Net attributable profit | |||||||
| Country | Jan.-Sep. 18 | ∆% | ∆% (1) | Jan.-Sep. 17 | Jan.-Sep. 18 | ∆% | ∆% (1) | Jan.-Sep. 17 |
| Argentina | 131 | (65.7) | (13.3) | 381 | (2) | n.s. | n.s. | 163 |
| Chile | 254 | (19.8) | (17.4) | 316 | 116 | (15.9) | (13.4) | 138 |
| Colombia | 481 | 0.9 | 6.1 | 476 | 181 | 36.1 | 43.1 | 133 |
| Peru | 536 | (2.1) | 4.9 | 547 | 128 | (1.4) | 5.7 | 130 |
| Other countries (2) | 126 | 19.3 | 26.8 | 106 | 44 | (15.9) | (9.6) | 52 |
| Total | 1,527 | (16.4) | 0.4 | 1,827 | 467 | (24.2) | (5.6) | 616 |
- (1) Figures at constant exchange rates.
- (2) Venezuela, Paraguay, Uruguay and Bolivia. Additionally, it includes eliminations and other charges.
South America. Relevant business indicators per country (Millions of Euros)
| Argentina | Chile | Colombia | Peru | |||||
|---|---|---|---|---|---|---|---|---|
| 30-09-18 | 31-12-17 | 30-09-18 | 31-12-17 | 30-09-18 | 31-12-17 | 30-09-18 | 31-12-17 | |
| Performing loans and advances to customers under management (1-2) | 3,799 | 2,822 | 1,996 | 14,070 | 12,631 | 12,323 | 13,447 | 13,182 |
| Non-performing loans and guarantees given (1) | 44 | 22 | 56 | 405 | 783 | 696 | 723 | 656 |
| Customer deposits under management (1-3) | 5,405 | 3,342 | 14 | 9,325 | 13,447 | 12,667 | 13,006 | 12,415 |
| Off-balance sheet funds (1-4) | 783 | 619 | - | 1,248 | 1,405 | 1,158 | 1,698 | 1,609 |
| Risk-weighted assets | 7,021 | 9,364 | 2,119 | 14,398 | 13,240 | 12,299 | 15,222 | 14,879 |
| Efficiency ratio (%) | 70,1 | 56.1 | 43.4 | 45.2 | 36.4 | 36.0 | 35.7 | 35.6 |
| NPL ratio (%) | 1,1 | 0.8 | 2.7 | 2.6 | 5.8 | 5.3 | 4.1 | 3.8 |
| NPL coverage ratio (%) | 175 | 198 | 104 | 60 | 102 | 88 | 99 | 100 |
| Cost of risk (%) | 1.22 | 0.61 | 0.80 | 0.76 | 1.95 | 2.59 | 1.40 | 1.14 |
- (1) Figures at constant exchange rates.
- (2) Excluding repos.
- (3) Excluding repos and including specific marketable debt securities.
- (4) Includes mutual funds, pension funds and other off-balance-sheet funds.