Mexico
Highlights
- Good performance of the activity.
- Expenses continue to grow below the rate of gross income.
- Double-digit year-on-year growth in net attributable profit.
- Good asset quality indicators.
Business activity (1)
(Year-on-year change at constant exchange rate. Data as of 30-09-2018)
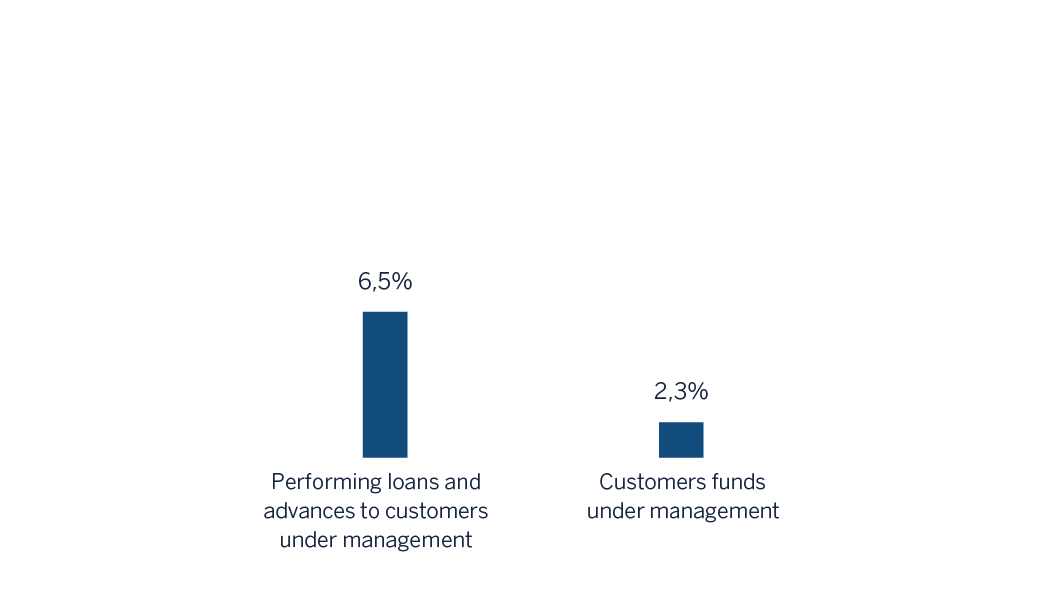
(1) Excluding repos.
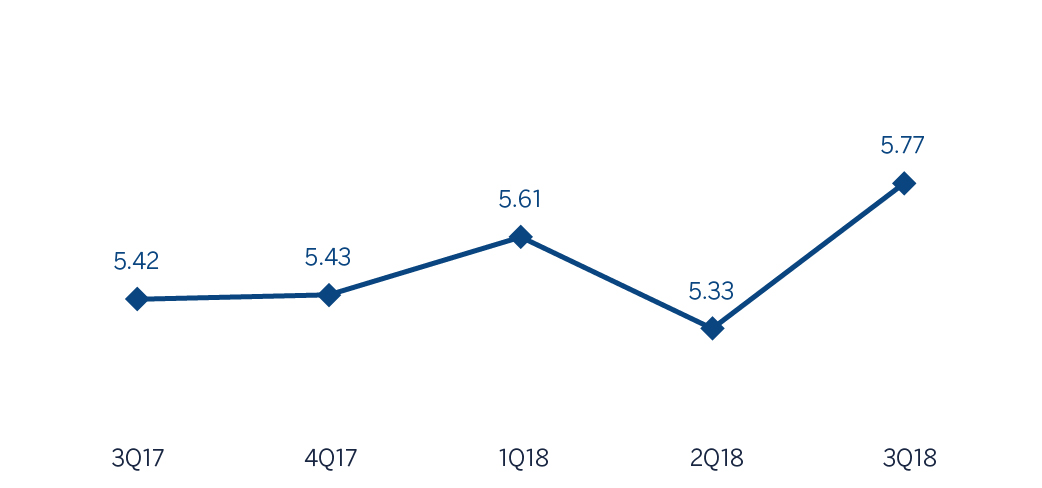
Net interest income/ATAs
(Percentage. Constant exchange rate)
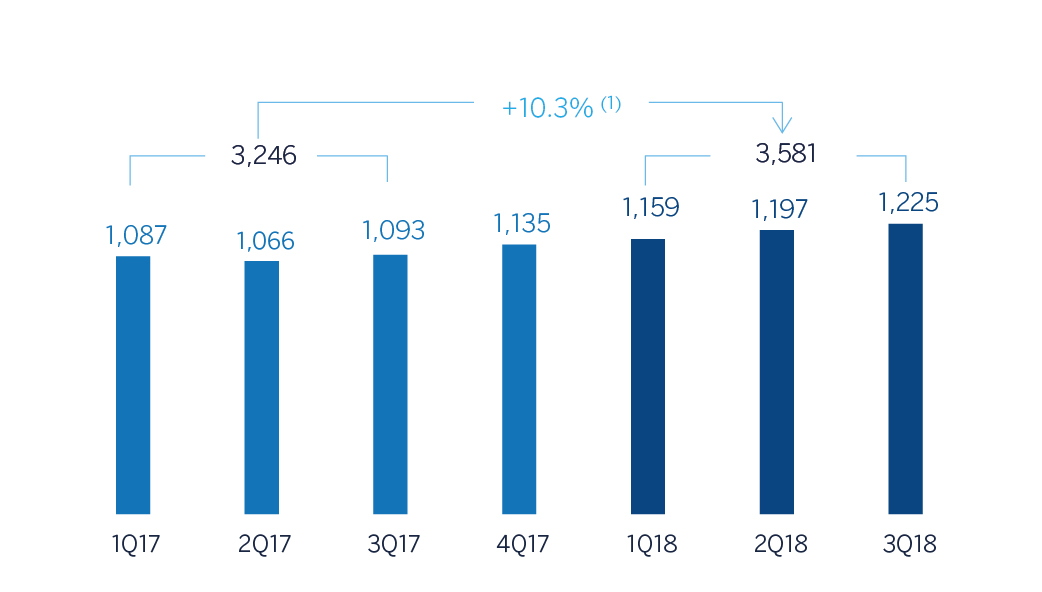
Operating income
(Millions of Euros at constant exchange rate)
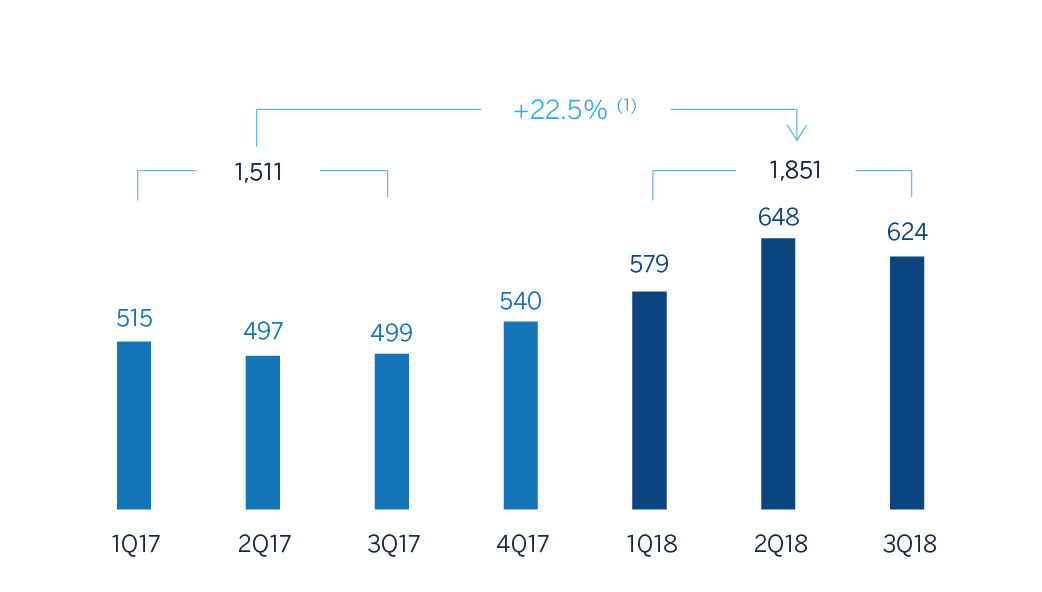
Net attributable profit
(Millions of Euros at constant exchange rate)
(1) At current exchange rate: 1.9%.
(1) At current exchange rate: 13.1%.
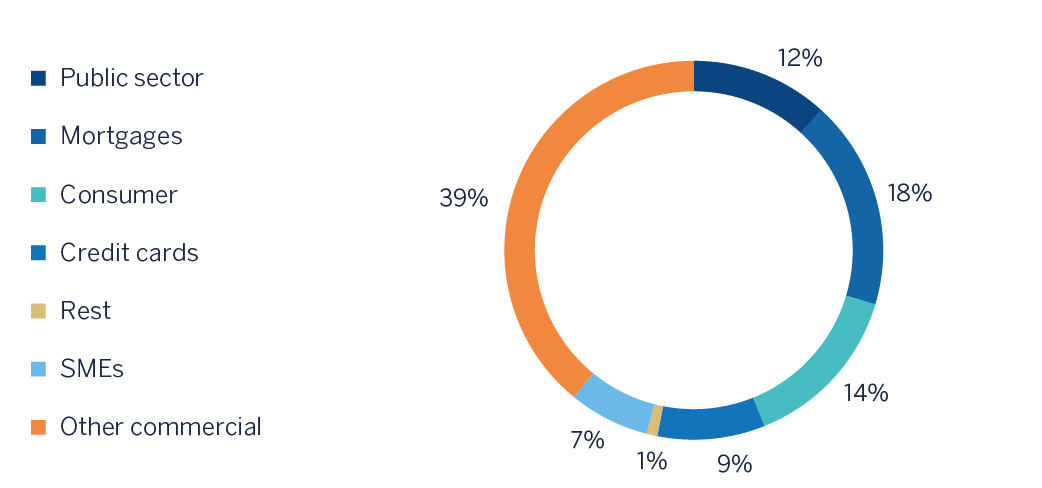
Breakdown of performing loans under management (1)
(30-09-2018)
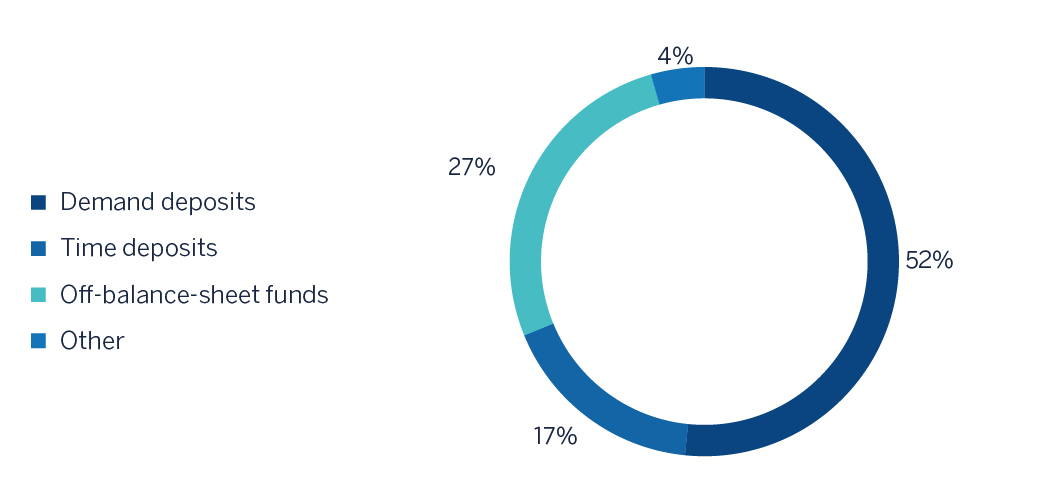
Breakdown of customer funds under management (1)
(30-09-2018)
(1) Excluding repos.
(1) Excluding repos.
Macro and industry trends
GDP growth in Mexico shrunk by a quarterly 0.2% (down 0.6% annualized) in the second quarter, measured at adjusted by seasonality. This fall contrasts with the good performance showed by the economy during the two previous quarters, and is explained by the fall in consumption, private investment, and the a lower public investment, explained by the change in government. When analyzing the evolution of activity on the supply side, both services and trade have lost dynamism, while in the primary sector there was a significant drop. Additionally, there is lower production in the oil sector and a slowdown in exports of manufactured products, mainly due to commercial tensions with the United States. To this extent, the new trade agreement between these two countries and Canada (still pending endorsement) significantly reduces the uncertainty.
With respect to inflation, the increase observed in recent months seems to be transitory, since it is mainly due to the increase in energy prices, while core inflation remains relatively stable. This, together with contained inflation pressures, suggests that additional interest rate hikes by Banxico might not be necessary for the remainder of the year.
For yet another quarter, the Mexican banking system showed excellent levels of solvency and asset quality. According to the latest available information from the Mexican National Banking and Securities Commission (CNBV) in August 2018, activity remained as strong as in previous quarters, with year-on-year growth in the volume of lending and deposits at 10.5% and 10.3%, respectively. Both the NPL ratio (2.2%) and NPL coverage ratio (151%) were stable. Finally, solvency in the system is at a comfortable level, with a capital adequacy ratio of 15.61% as of the end of June 2018.
Activity
Unless expressly stated otherwise, all the comments below on rates of change, for both activity and earnings, will be given at constant exchange rate. These rates, together with changes at current exchange rate, can be seen in the attached tables of financial statements and relevant business indicators.
The most relevant aspects related to the area’s activity year-to-date as of 30-September-2018 were:
- Increase in lending (performing loans under management) throughout the first nine months of 2018 (up 6.0%) and in year-on-year terms (up 6.5%). BBVA maintains its leading position in the country, with a market share of 22.8% in the outstanding portfolio of performing loans, according to local figures from the CNBV at the end of August 2018.
- By portfolio: the wholesale portfolio, which represents 51.8% of total lending, increased by 7.1% year-to-date and 6.9% in year-on-year terms, mainly driven by medium-sized companies. The retail portfolio increased by 4.9% (including small and medium-sized enterprises) during the first nine months of the year (up 6.0% year-on-year), strongly supported by consumer loans (payroll, personal and auto), which rose by 6.8% between January and September (6.9% year-on-year). The credit cards portfolio showed a slight decrease of 0.2% during the first nine months of the year whereas the year-on-year increase amounts to 3.1%. This is due to the high monthly amortization rate (over 95%) of the amount invoiced in the month by customers with this type of credits.
- With respect to the asset quality indicators of the quarter, the NPL ratio stayed stable at 2.0% (2.0% as at 30-June-2018) whereas the NPL coverage ratio closed at 149%.
- Total customer funds (customer deposits under management, mutual funds and other off-balance sheet funds) posted a year-to-date increase of 2.1% and a year-on-year growth of 2.3%, explained by the decrease in demand deposits (down 2.5% year-to-date, and down 2.2% year-on-year). On the other hand, time deposits grew by 10.9% and 9.2%, respectively. Mutual funds increased by 7.3% year-to-date (up 8.4% year-on-year).
- A profitable funding mix: low-cost items account for 75% of total customer deposits under management.
Results
BBVA in Mexico posted a net attributable profit in the first nine months of 2018 of €1,851 million, a year-on-year increase of 22.5%. Main highlights on the income statement are:
- Positive performance of net interest income, which increased by 8.3% year-on-year, even higher than the increase in volumes of activity (up 6.5%).
- Good performance of net fees and commissions, with growth of 7.3% over the last twelve months, driven mainly by an increased activity in mutual funds and investment banking as well as a higher volume of transactions with credit card and electronic banking customers.
- NTI increased (up 19.3% year-on-year) due to the positive results from the Global Markets Unit.
- In other income/expenses, the comparison was negative year-on-year (down 7.0%) because the good performance from insurance activity was not able to compensate the contributions to the FGD.
- Operating expenses continued to grow at a controlled pace (up 3.7% year-on-year) and below the area's gross income growth of 8.0%. As a result, the efficiency ratio has continued to improve and stood at 32.9% as of 30-September-2018.
- Adequate risk management has been reflected in the 9.9% decline in impairment losses on financial assets, explained by a change in the mix of the loan portfolio. As a result, the cumulative cost of risk in the area closed at 2.82% from 3.24% as of December 2017.
- Other gains (losses) included the extraordinary income from the sale of BBVA Bancomer's stake in a real-estate development in the first quarter of 2018, and the capital gain from the sale of a building by Bancomer in the second quarter of 2018.
Financial statements and relevant business indicators (Millions of Euros and percentage)
| IFRS 9 | IAS 39 | ||||
|---|---|---|---|---|---|
| Income statement | Jan.-Sep. 18 | ∆% | ∆%(1) | Jan.-Sep. 17 | |
| Net interest income | 4,110 | 0.0 | 8.3 | 4,109 | |
| Net fees and commissions | 900 | (0.9) | 7.3 | 908 | |
| Net trading income | 199 | 10.2 | 19.3 | 180 | |
| Other operating income and expenses | 131 | (14.1) | (7.0) | 153 | |
| Gross income | 5,340 | (0.2) | 8.0 | 5,351 | |
| Operating expenses | (1,759) | (4.2) | 3.7 | (1,836) | |
| Personnel expenses | (761) | (3.6) | 4.4 | (789) | |
| Other administrative expenses | (810) | (4.9) | 2.9 | (852) | |
| Depreciation | (188) | (3.5) | 4.5 | (195) | |
| Operating income | 3,581 | 1.9 | 10.3 | 3,514 | |
| Impairment on financial assets not measured at fair value through profit or loss | (1,055) | (16.8) | (9.9) | (1,268) | |
| Provisions or reversal of provisions and other results | 32 | n.s. | n.s. | (9) | |
| Profit/(loss) before tax | 2,558 | 14.3 | 23.8 | 2,237 | |
| Income tax | (707) | 17.7 | 27.4 | (601) | |
| Profit/(loss) for the year | 1,851 | 13.1 | 22.5 | 1,636 | |
| Non-controlling interests | (0) | 11.8 | 21.0 | (0) | |
| Net attributable profit | 1,851 | 13.1 | 22.5 | 1,636 | |
| IFRS 9 | IAS 39 | ||||
|---|---|---|---|---|---|
| Balance sheets | 30-09-18 | ∆% | ∆%(1) | 31-12-17 | |
| Cash, cash balances at central banks and other demand deposits | 6,225 | (29.5) | (35.1) | 8,833 | |
| Financial assets designated at fair value | 26,955 | (5.8) | (13.3) | 28,627 | |
| of which loans and advances | 130 | (91.7) | (92.3) | 1,558 | |
| Financial assets at amortized cost | 58,815 | 23.3 | 13.5 | 47,691 | |
| of which loans and advances to customers | 52,039 | 13.7 | 4.7 | 45,768 | |
| Tangible assets | 1,804 | 3.1 | (5.1) | 1,749 | |
| Other assets | 2,326 | (67.5) | (70.1) | 7,160 | |
| Total assets/liabilities and equity | 96,124 | 2.2 | (5.9) | 94,061 | |
| Financial liabilities held for trading and designated at fair value through profit or loss | 16,300 | 73.3 | 59.5 | 9,405 | |
| Deposits from central banks and credit institutions | 2,659 | (54.6) | (58.2) | 5,853 | |
| Deposits from customers | 50,327 | 0.7 | (7.3) | 49,964 | |
| Debt certificates | 8,575 | 17.3 | 7.9 | 7,312 | |
| Other liabilities | 13,986 | (20.7) | (27.0) | 17,627 | |
| Economic capital allocated | 4,278 | 9.7 | 1.0 | 3,901 | |
| Relevant business indicators | 30-09-18 | ∆% | ∆%(1) | 31-12-17 |
|---|---|---|---|---|
| Performing loans and advances to customers under management (2) | 52,049 | 15.2 | 6.0 | 45,196 |
| Non-performing loans | 1,136 | 1.1 | (7.0) | 1,124 |
| Customer deposits under management (2) | 49,263 | 9.2 | 0.6 | 45,093 |
| Off-balance sheet funds (3) | 22,323 | 14.6 | 5.5 | 19,472 |
| Risk-weighted assets | 54,391 | 21.0 | 11.4 | 44,941 |
| Efficiency ratio (%) | 32.9 | 34.4 | ||
| NPL ratio (%) | 2.0 | 2.3 | ||
| NPL coverage ratio (%) | 149 | 123 | ||
| Cost of risk (%) | 2.82 | 3.24 |
(1) Figures at constant exchange rate.
(2) Excluding repos.
(3) Includes mutual funds, pension funds and other off-balance sheet funds.