Turkey
Highlights
- Activity impacted by the evolution of exchange rates.
- Good performance of recurring revenue items.
- Control of operating expenses.
- Risk indicators affected by the update of the macroeconomic scenario and certain negative impacts of the portfolio of wholesale customers.
Business activity (1)
(Year-on-year change at constant exchange rate. Data as of 30-09-2018)
(1) Excluding repos.
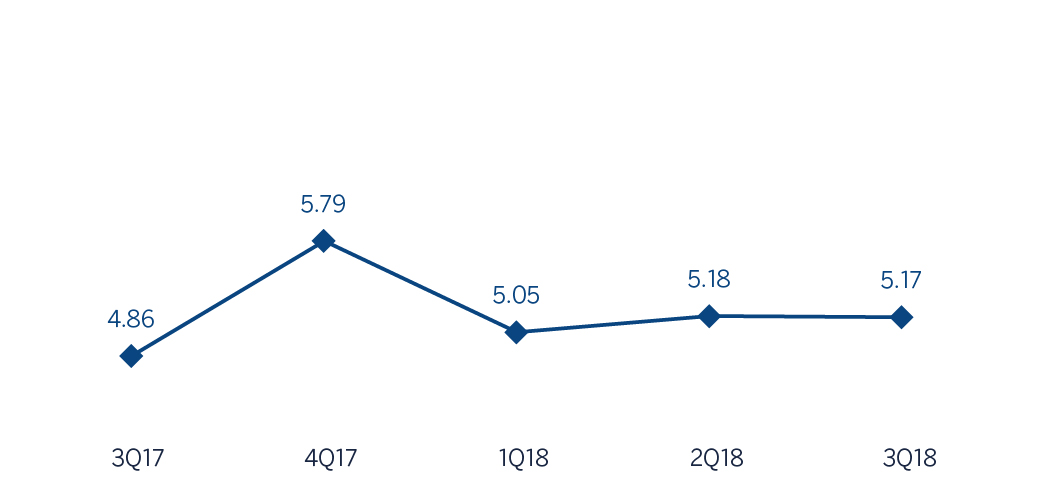
Net interest income/ATAs
(Percentage. Constant exchange rate)
Operating income
(Millions of Euros at constant exchange rate)
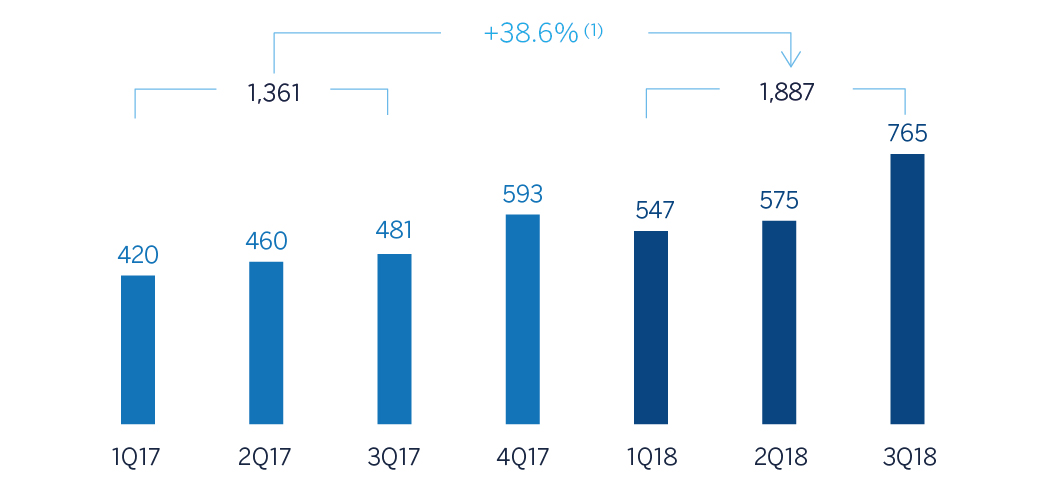
(1) At current exchange rate: 0.8%.
Net attributable profit
(Millions of Euros at constant exchange rate)
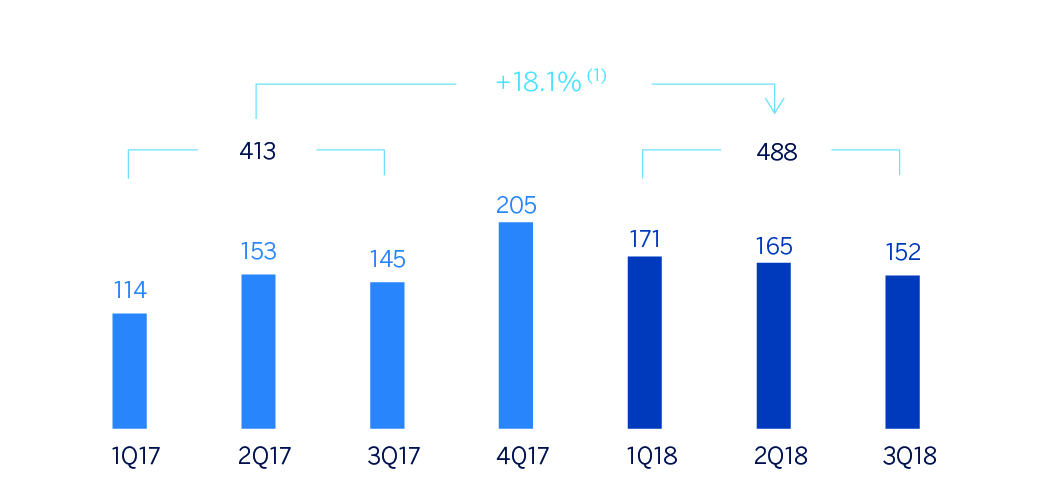
(1) At current exchange rate: -14.1%.
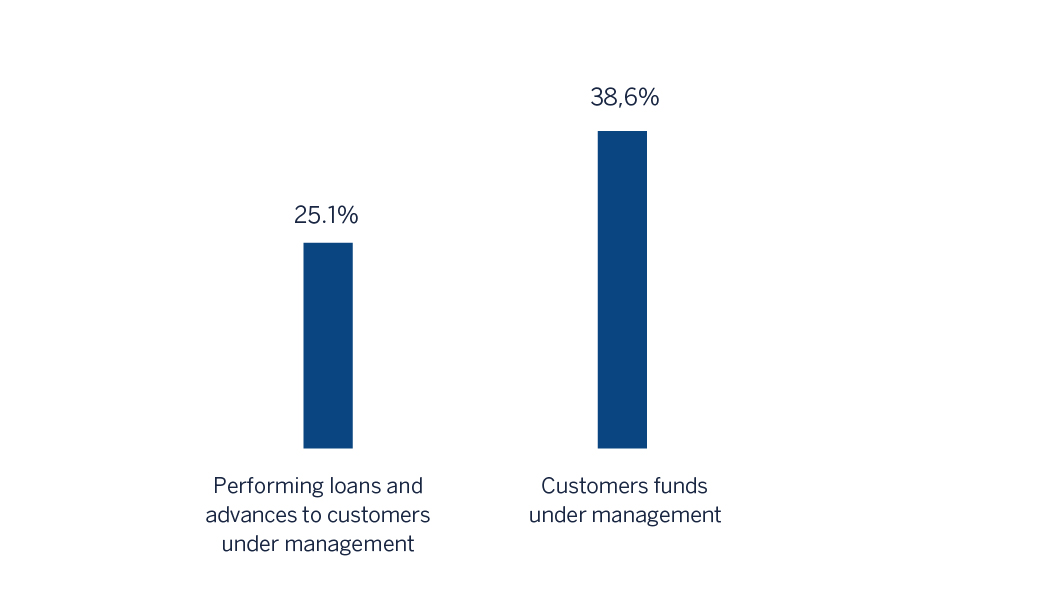
Breakdown of performing loans under management (1)
(30-09-2018)
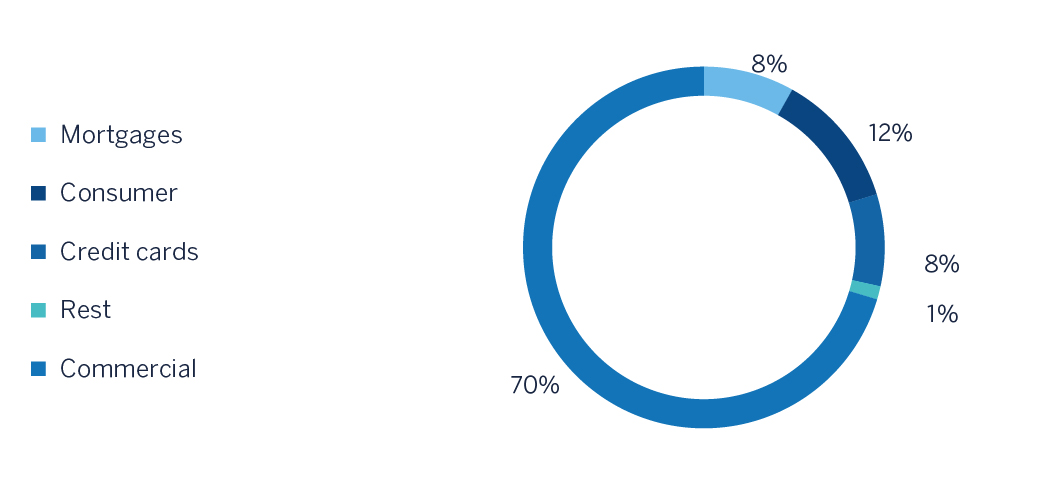
(1) Excluding repos.
Breakdown of customer funds under management (1)
(30-09-2018)
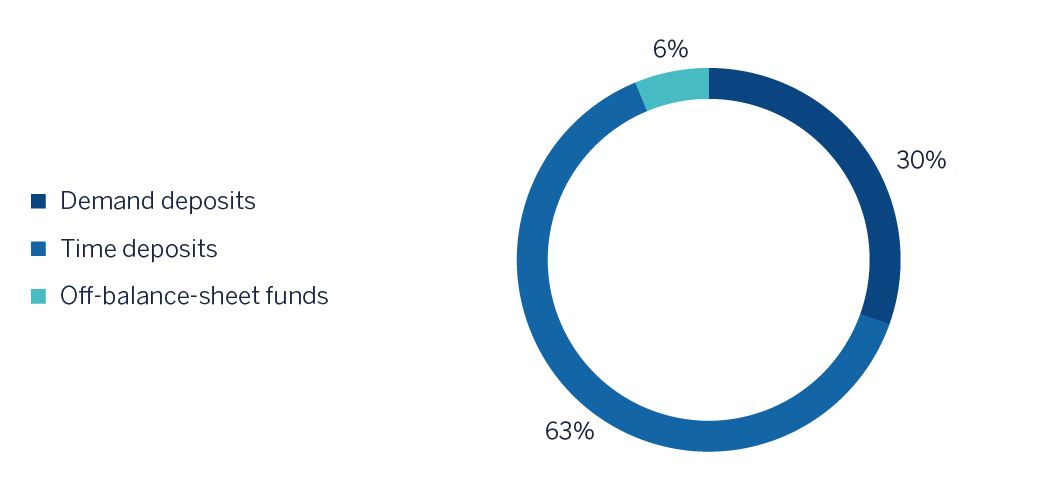
(1) Excluding repos.
Macro and industry trends
According to the most recent figures from the Turkish Statistical Institute, Turkey’s year-on-year economic growth was 5.2% in the second quarter of 2018, supported by lower contribution of domestic demand, while external demand contribution turned positive.
Interannual inflation climbed to 24.5% in September (the highest level since June 2003), as a result of the currency depreciation, the increase in costs and high food inflation, caused by unfavourable weather conditions.
The CBRT hiked its funding interest rate by 625 basis points (1.125 basis points year-to-date increase) up to 24.0% in its September meeting. CBRT decisions do not only help to fight against inflation and inflation expectations but also to support financial stability by reducing pressures on the currency.
The New Economic Program (NEP) of the Turkish Government recommends a more prudent fiscal consolidation plan which will help maintain the public accounts balanced and will support monetary policy in order to balance the economy towards a more sustainable path. The plan contains a mid-term deficit goal of 1.7% over GDP.
Regarding the Turkish financial sector evolution, year-on-year credit growth has decelerated during the third quarter of 2018, mainly due to business lending. By the end of September 2018, the year-on-year total lending growth rate (adjusted for the depreciation of the lira effect) reached up to 9.0%. Deposits from customers also have shown a slow-down trend. The year-on-year total deposits growth rate fell to 6.4% (adjusted for the depreciation of the lira effect). Turkish-lira deposits grew by 12.5% and foreign-currency deposits (mainly in U.S. dollars) decreased by 10.2%. Lastly, the NPL ratio closed at 3.1% for September (15 basis points rise in the third quarter).
Activity
Unless expressly stated and communicated otherwise, rates of changes explained ahead, both for activity and for income, will be presented at constant exchange rates. These rates, together with changes at current exchange rates, can be observed in the attached tables of the financial statements and relevant business indicators.
The most relevant aspects related to the area’s activity year-to-date as of September 30, 2018 have been:
- Lending activity growth (performing loans under management) grew by 19.7% year-to-date (up by 25.1% in year-on-year terms) driven by the evolution of exchange rates. Garanti Bank Turkish-lira loans remained flat in the quarter and as a result, year-to-date growth stood at 8.5%. Furthermore, Garanti Bank foreign-currency loans (in U.S. dollars) decreased by -8.3% year-to-date.
- By segments, although business banking and consumer loans in Turkish-lira grew during the first half of the year, Turkish-lira lending, as aforementioned, remained flat in the third quarter, mainly due to increasing interest rates.
- In terms of asset quality, the NPL ratio closed at 5.2% due to the worsening of macroeconomic conditions and the inflow of certain doubtful clients. On the other hand, the NPL coverage ratio stood at 76%.
- Customer deposits (59% of total liabilities in the area as of September 30, 2018) remained the main source of funding for Turkish´s balance sheet and grew by 33.6% in year-to-date (up 41.1% in year-on-year terms) highly supported by the growth of Garanti Bank Turkish-lira deposits and the increase in exchange rates. In a quarterly basis, Turkish-lira customer deposits increased by 9.1% and strengthened Garanti Bank funding source. Nevertheless, during the third quarter of 2018, foreign-currency customer deposits (in U.S. dollars) followed a declining trend by -3.0%. Sound performance of demand deposits (almost zero cost) with a weight of 33% over total customer deposits. Additionally, retail and SMEs deposit concentration continued, which is enhancing low funding costs.
- All funding and liquidity ratios remained within comfort levels, and Garanti maintained its solvency levels well above requirements.
Results
Turkey generated a cumulative attributable profit of €488m during the first nine months of 2018, representing a 18.1% year-on-year growth. The most significant aspects of the year-on-year evolution in the income statement were as follows:
- Positive performance of interest income (up to 26.4%) despite loan-to-deposit pressure as a consequence of the higher contribution from inflation-linked bonds.
- Income from fees and commissions grew by 32.0%. This significant increase was mainly driven by the positive performance in payment systems, advances, money transfers and other commissions.
- Increase in NTI (by 99.8%) taking advantage of the volatile conditions of global markets, asset and liabilities management and gains on derivatives.
- Gross income was up 28.1% in the third quarter of 2018 compared to the same period as of 2017, thanks to the increased core banking activities.
- Operating expenses increased by 10.8%, slightly below the average inflation rate (13.75%) and well below the year-on-year growth rate in gross income, as a strict cost-control discipline exists. Due to this, the efficiency ratio declined to 32.6%.
- Impairment on financial assets increased by 149.5%, due to certain negative impacts coming from the wholesale-customer portfolio and the macroeconomic scenario update. As a result, the cumulative cost of risk of the area was located in a 1.72%.
Financial statements and relevant business indicators (Millions of Euros and percentage)
| IFRS 9 | IAS 39 | ||||
|---|---|---|---|---|---|
| Income statement | Jan.-Sep. 18 | ∆% | ∆%(1) | Jan.-Sep. 17 | |
| Net interest income | 2,204 | (8.1) | 26.4 | 2,399 | |
| Net fees and commissions | 515 | (4.1) | 32.0 | 537 | |
| Net trading income | 31 | 45.2 | 99.8 | 22 | |
| Other operating income and expenses | 51 | 1.0 | 39.0 | 50 | |
| Gross income | 2,801 | (6.9) | 28.1 | 3,008 | |
| Operating expenses | (914) | (19.5) | 10.8 | (1,135) | |
| Personnel expenses | (486) | (19.7) | 10.5 | (605) | |
| Other administrative expenses | (323) | (17.8) | 13.1 | (392) | |
| Depreciation | (105) | (23.4) | 5.3 | (137) | |
| Operating income | 1,887 | 0.8 | 38.6 | 1,873 | |
| Impairment on financial assets not measured at fair value through profit or loss | (638) | 81.4 | 149.5 | (352) | |
| Provisions or reversal of provisions and other results | 17 | n.s. | n.s. | (12) | |
| Profit/(loss) before tax | 1,267 | (16.1) | 15.4 | 1,510 | |
| Income tax | (278) | (9.8) | 24.1 | (308) | |
| Profit/(loss) for the year | 989 | (17.7) | 13.2 | 1.201 | |
| Non-controlling interests | (501) | (20.9) | 8.8 | (634) | |
| Net attributable profit | 488 | (14.1) | 18.1 | 568 | |
| IFRS 9 | IAS 39 | ||||
|---|---|---|---|---|---|
| Balance sheets | 30-09-18 | ∆% | ∆%(1) | 31-12-17 | |
| Cash, cash balances at central banks and other demand deposits | 7,628 | 89.0 | 189.5 | 4,036 | |
| Financial assets designated at fair value | 5,545 | (13.6) | 32.3 | 6,419 | |
| of which loans and advances | - | - | - | - | |
| Financial assets at amortized cost | 50,344 | (22.6) | 18.5 | 65,083 | |
| of which loans and advances to customers | 40,833 | (20.5) | 21.8 | 51,378 | |
| Tangible assets | 924 | (31.2) | 5.4 | 1,344 | |
| Other assets | 1,593 | (12.0) | 34.7 | 1,811 | |
| Total assets/liabilities and equity | 66,035 | (16.1) | 28.6 | 78,694 | |
| Financial liabilities held for trading and designated at fair value through profit or loss | 2,562 | 295.6 | n.s. | 648 | |
| Deposits from central banks and credit institutions | 8,539 | (23.7) | 16.8 | 11,195 | |
| Deposits from customers | 38,841 | (13.1) | 33.1 | 44,691 | |
| Debt certificates | 5,738 | (31.2) | 5.3 | 8,346 | |
| Other liabilities | 8,296 | (26.7) | 12.3 | 11,321 | |
| Economic capital allocated | 2,059 | (17.4) | 26.5 | 2,493 | |
| Relevant business indicators | 30-09-18 | ∆% | ∆%(1) | 31-12-17 |
|---|---|---|---|---|
| Performing loans and advances to customers under management (2) | 40,181 | (21.9) | 19.7 | 51,438 |
| Non-performing loans | 2,774 | 8.7 | 66.5 | 2,553 |
| Customer deposits under management (2) | 38,836 | (12.8) | 33.6 | 44,539 |
| Off-balance sheet funds (3) | 2,583 | (33.8) | 1.4 | 3,902 |
| Risk-weighted assets | 52,822 | (15.8) | 28.9 | 62,768 |
| Efficiency ratio (%) | 32.6 | 36.5 | ||
| NPL ratio (%) | 5.2 | 3.9 | ||
| NPL coverage ratio (%) | 76 | 85 | ||
| Cost of risk (%) | 1.72 | 0.82 |
(1) Figures at constant exchange rate.
(2) Excluding repos.
(3) Includes mutual funds, pension funds and other off-balance-sheet funds.