
Other information: Corporate & Investment Banking
Highlights
- Good performance of activity with customers.
- Leadership position in green and sustainable loans.
- Positive evolution of net interest income, linked to the activity.
- Net attributable profit positively impacted by good performance in the fourth quarter.
Business activity (1)
(Year-on-year change at constant exchange rates. Data as of 31-12-19)
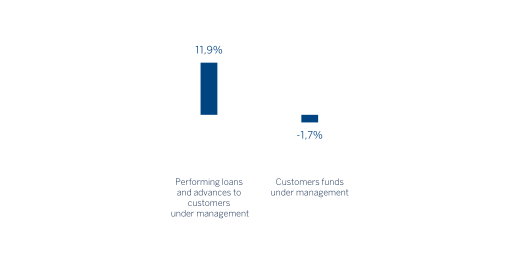
(1) Excluding repos.
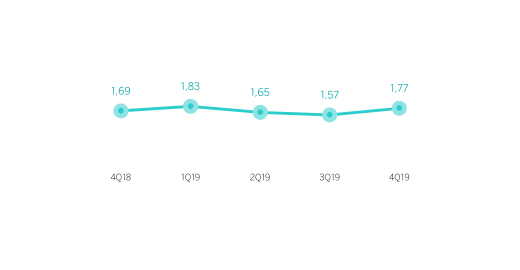
Gross income/ATAs
(Percentage. Constant exchange rates)
Operating income
(Millions of euros at constant exchange rates)
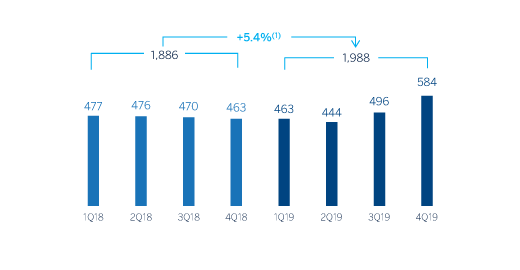
(1) At current exchange rate: +1.4%.
Net attributable profit
(Millions of euros at constant exchange rates)
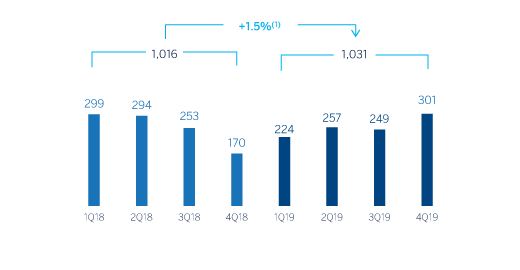
(1) At current exchange rate: +1.1%.
Financial statements and relevant business indicators (Millions of euros and percentage)
| Income statement | 2019 | ∆% | ∆% (1) | 2018 |
|---|---|---|---|---|
| Net interest income | 1,541 | 4.2 | 7.5 | 1,479 |
| Net fees and commissions | 730 | 5.1 | 5.9 | 695 |
| Net trading income | 839 | (2.4) | 0.5 | 860 |
| Other operating income and expenses | (56) | 35.7 | 26.3 | (41) |
| Gross income | 3,055 | 2.1 | 4.8 | 2,993 |
| Operating expenses | (1,067) | 3.4 | 3.8 | (1,032) |
| Personnel expenses | (479) | 5.8 | 5.6 | (452) |
| Other administrative expenses | (463) | (1.7) | (0.5) | (471) |
| Depreciation | (126) | 15.4 | 14.7 | (109) |
| Operating income | 1,988 | 1.4 | 5.4 | 1,960 |
| Impairment on financial assets not measured at fair value through profit or loss | (237) | (32.5) | (22.4) | (352) |
| Provisions or reversal of provisions and other results | 8 | n.s. | n.s. | (36) |
| Profit/(loss) before tax | 1,759 | 11.8 | 13.9 | 1,573 |
| Income tax | (431) | 18.4 | 21.3 | (364) |
| Profit/(loss) for the year | 1,328 | 9.9 | 11.7 | 1,209 |
| Non-controlling interests | (297) | 57.0 | 71.2 | (189) |
| Net attributable profit | 1,031 | 1.1 | 1.5 | 1,020 |
- (1) Figures at constant exchange rates.
| Balance sheets | 31-12-19 | ∆% | ∆% (1) | 31-12-18 |
|---|---|---|---|---|
| Cash. cash balances at central banks and other demand deposits | 3,513 | (30.9) | (31.9) | 5,087 |
| Financial assets designated at fair value | 105,386 | 14.1 | 13.2 | 92,391 |
| Of which Loans and advances | 34,153 | 18.5 | 18.5 | 28,826 |
| Financial assets at amortized cost | 76,169 | 16.9 | 17.4 | 65,167 |
| Of which loans and advances to customers | 65,915 | 12.3 | 12.7 | 58,720 |
| Inter-area positions | - | - | - | - |
| Tangible assets | 63 | 120.7 | 119.5 | 29 |
| Other assets | 2,506 | 15.0 | 12.1 | 2,179 |
| Total assets/liabilities and equity | 187,637 | 13.8 | 13.5 | 164,852 |
| Financial liabilities held for trading and designated at fair value through profit or loss | 91,657 | 25.3 | 25.1 | 73,163 |
| Deposits from central banks and credit institutions | 15,426 | (20.7) | (21.9) | 19,464 |
| Deposits from customers | 38,864 | (9.8) | (10.2) | 43,069 |
| Debt certificates | 2,625 | 36.0 | 34.5 | 1,931 |
| Inter-area positions | 31,678 | 60.5 | 61.9 | 19,742 |
| Other liabilities | 2,899 | (33.3) | (33.9) | 4,348 |
| Economic capital allocated | 4,487 | 43.1 | 41.9 | 3,136 |
- (1) Figures at constant exchange rates.
| Relevant business indicators | 31-12-19 | ∆% | ∆% (1) | 31-12-18 |
|---|---|---|---|---|
| Performing loans and advances to customers under management (2) | 65,509 | 11.4 | 11.9 | 58,796 |
| Non-performing loans | 1,211 | 58.9 | 63.6 | 762 |
| Customer deposits under management (2) | 38,848 | (2.0) | (2.0) | 39,642 |
| Off-balance sheet funds (3) | 1,037 | 4.4 | 8.3 | 993 |
| Efficiency ratio (%) | 34.9 | 34.5 |
- (1) Figures at constant exchange rates.
- (2) Excluding repos.
- (3) Includes mutual funds. pension funds and other off-balance sheet funds.
Activity
Unless expressly stated otherwise, all the comments below on rates of change, for both activity and profit and loss, will be given at constant exchange rates. These rates, together with changes at current exchange rates, can be found in the attached tables of the financial statements and relevant business indicators.
The most relevant aspects related to the area's activity in 2019 were:
- Despite the existence of pressure on margins and excess liquidity in the market, lending activity (performing loans under management) increased by 11.9%. By geographic area, the comparison in the United States, South America and Rest of Eurasia was more favorable.
- Total customer funds fell 1.7% in 2019 mainly due to a decrease in customer funds (down 2.0%).
- BBVA was one of the most active financial institutions in sustainability and digitalization, two processes that the Bank wants to continue to promote together with its customers.
- During 2019, BBVA was one of the most active institutions in the area of sustainable financing, having participated in 36 transactions classified as green and/or linked to sustainability criteria (ESG score, environmental and social KPIs) certified by reputable independent consultants. Of these 36 transactions, 22 were led by BBVA as a sustainability coordinator.
- This BBVA leadership was demonstrated through relevant operations in different countries (Spain, the United Kingdom, France, Portugal, Belgium, Mexico and China), and various sectors including hotelier, energy (gas and electricity), recycling and automotive components, among others. The 36 operations compared positively with the 23 operations for the whole of 2018.
- In terms of innovation, following the recognition of financing via blockchain in 2018, BBVA was a pioneer in linking a company's degree of digitization to its bank financing with the so-called Digital Loan or D-loan. The syndicated loan, placed in Asia and led by BBVA, is the first of its kind worldwide, and demonstrates that the Bank remains at the forefront of innovative solutions for its customers.
Results
CIB generated a net attributable profit of €1,031m in 2019, up 1.5% (up 20.9% in the quarter). The most relevant aspects of the year-on-year changes in the income statement are summarized below:
- Good performance of net interest income (up 7.5%) linked to the activity, in a complex environment of interest rate cuts with a remarkable performance in transactional banking.
- Increase of net fees and commissions (up 5.9%), supported by the transactional business and bond origination in Global Markets. By geographic area, the increases in Spain and Mexico stand out and, to a lesser extent, in South America and Rest of Eurasia. The fourth quarter includes commissions from Corporate Finance operations in Spain and Mexico.
- NTI is flattish compared to the previous year (up 0.5%) resulting from a scenario of relevant cuts in interest rates during the year, which has offset the good performance of activity with customers and foreign exchange operations.
- Despite the complex market environment, gross income increased on year-on-year terms (up 4.8%).
- Efficient management of operating expenses, with increased investment in technological projects and containment of discretionary expenses.
- Lower impairment on financial assets compared to 2018 (down 22.4%).