
South America
Highlights
- Positive evolution of activity in the main countries: Argentina, Colombia and Peru.
- Improved efficiency ratio, supported by the growth in net interest income and the control in operating expenses.
- Greater NTI contribution in the year due to the positive effect derived from Prisma sale in Argentina and the positive contribution of foreign exchange transactions.
- Net attributable profit impacted by Argentina's inflation adjustment.
- Positive contribution of the main countries to the Group’s attributable profit.
Business activity (1)
(Year-on-year change at constant exchange rates. Data as of 31-12-19)

(1) Excluding repos.
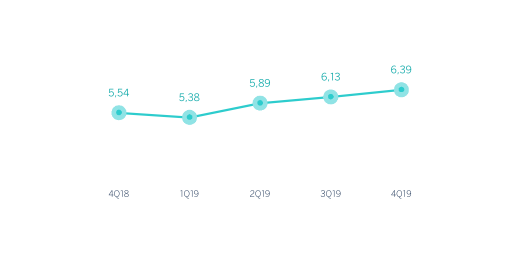
Net interest income/ATAs
(Percentage. Constant exchange rates)
Operating income
(Millions of euros at constant exchange rates)

(1) At current exchange rate: +14.3%.
Net attributable profit
(Millions of euros at constant exchange rates)
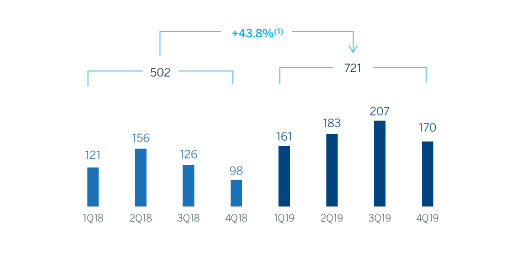
(1) At current exchange rate: +24.8%
Financial statements and relevant business indicators (Millions of euros and percentage)
| Income statement | 2019 | ∆% | ∆% (1) | 2018 |
|---|---|---|---|---|
| Net interest income | 3,196 | 6.2 | 15.2 | 3,009 |
| Net fees and commissions | 557 | (11.9) | (5.0) | 631 |
| Net trading income | 576 | 42.3 | 58.1 | 405 |
| Other operating income and expenses | (479) | 39.1 | 33.6 | (344) |
| Gross income | 3,850 | 4.0 | 14.3 | 3,701 |
| Operating expenses | (1,574) | (7.9) | 1.6 | (1,709) |
| Personnel expenses | (794) | (6.1) | 4.2 | (846) |
| Other administrative expenses | (609) | (17.5) | (9.0) | (738) |
| Depreciation | (171) | 36.7 | 45.6 | (125) |
| Operating income | 2,276 | 14.3 | 25.2 | 1,992 |
| Impaiment on financial assets not measured at fair value through profit or loss | (777) | 21.7 | 29.4 | (638) |
| Provisions or reversal of provisions and other results | (103) | 57.8 | 83.4 | (65) |
| Profit/(loss) before tax | 1,396 | 8.3 | 20.1 | 1,288 |
| Income tax | (368) | (21.6) | (16.3) | (469) |
| Profit/(loss) for the year | 1,028 | 25.5 | 42.3 | 819 |
| Non-controlling interests | (307) | 27.1 | 38.8 | (241) |
| Net attributable profit | 721 | 24.8 | 43.8 | 578 |
| BBVA Chile (2) | - | - | - | 64 |
| Net attributable profit excluding BBVA Chile | 721 | 40.4 | 64.0 | 514 |
| Balance sheets | 31-12-19 | ∆% | ∆% (1) | 31-12-18 |
|---|---|---|---|---|
| Cash, cash balances at central banks and other demand deposits | 8,601 | (4.3) | 5.3 | 8,987 |
| Financial assets designated at fair value | 6,120 | 8.6 | 13.1 | 5,634 |
| Of which loans and advances | 114 | (11.7) | (13.2) | 129 |
| Financial assets at amortized cost | 37,869 | 3.3 | 7.4 | 36,649 |
| Of which loans and advances to customers | 35,701 | 3.6 | 7.5 | 34,469 |
| Tangible assets | 968 | 19.1 | 25.3 | 813 |
| Other assets | 1,438 | (37.2) | (34.1) | 2,290 |
| Total assets/liabilities and equity | 54,996 | 1.1 | 6.1 | 54,373 |
| Financial liabilities held for trading and designated at fair value through profit or loss | 1,860 | 37.1 | 36.0 | 1,357 |
| Deposits from central banks and credit institutions | 3,656 | 18.9 | 20.0 | 3,076 |
| Deposits from customers | 36,104 | 0.7 | 6.4 | 35,842 |
| Debt certificates | 3,220 | 0.4 | 0.9 | 3,206 |
| Other liabilities | 7,664 | (10.3) | (4.8) | 8,539 |
| Economic capital allocated | 2,492 | 5.8 | 11.9 | 2,355 |
| Relevant business indicators | 31-12-19 | ∆% | ∆% (1) | 31-12-18 |
|---|---|---|---|---|
| Performing loans and advances to customers under management (3) | 35,598 | 3.1 | 7.0 | 34,518 |
| Non-performing loans | 1,853 | 6.1 | 6.6 | 1,747 |
| Customer deposits under management (4) | 36,123 | 0.4 | 6.0 | 35,984 |
| Off-balance sheet funds (5) | 12,864 | 10.3 | 10.7 | 11,662 |
| Risk-weighted assets | 45,674 | 6.9 | 13.5 | 42,724 |
| Efficiency ratio (%) | 40.9 | 46.2 | ||
| NPL ratio (%) | 4.4 | 4.3 | ||
| NPL coverage ratio (%) | 100 | 97 | ||
| Cost of risk (%) | 1.88 | 1.44 |
- (1) Figures at constant exchange rates.
- (2) Earnings generated by BBVA Chile until its sale on July 6, 2018.
- (3) Excluding repos.
- (4) Excluding repos and including specific marketable debt securities.
- (5) Includes mutual funds, pension funds and other off-balance sheet funds.
South America. Data per country (Millions of euros)
| Operating income | Net attributable profit | |||||||
|---|---|---|---|---|---|---|---|---|
| Country | 2019 | ∆% | ∆% (1) | 2018 | 2019 | ∆% | ∆% (1) | 2018 |
| Argentina | 548 | 213.6 | n.s. | 175 | 133 | n.s. | n.s. | (32) |
| Chile | 134 | (53.7) | (51.9) | 289 | 55 | (60.0) | (58.5) | 137 |
| Colombia | 639 | 0.2 | 5.6 | 638 | 267 | 19.1 | 25.5 | 224 |
| Peru | 827 | 13.4 | 9.2 | 730 | 202 | 5.9 | 1.9 | 191 |
| Other countries (2) | 128 | (20.4) | (16.5) | 160 | 65 | 11.6 | 19.9 | 59 |
| Total | 2,276 | 14.3 | 25.2 | 1,992 | 721 | 24.8 | 43.8 | 578 |
- (1) Figures at constant exchange rates.
- (2) Venezuela, Paraguay, Uruguay and Bolivia. Additionally, it includes eliminations and other charges.
South America. Relevant business indicators per country (Millions of euros)
| Argentina | Chile | Colombia | Peru | |||||
|---|---|---|---|---|---|---|---|---|
| 31-12-19 | 31-12-18 | 31-12-19 | 31-12-18 | 31-12-19 | 31-12-18 | 31-12-19 | 31-12-18 | |
| Performing loans and advances to customers under management (1) (2) | 2,929 | 2,716 | 1,806 | 1,935 | 12,853 | 12,040 | 15,030 | 13,859 |
| Non-performing loans and guarantees given (1) | 105 | 56 | 74 | 55 | 741 | 782 | 806 | 736 |
| Customer deposits under management (1) (3) | 4,366 | 3,851 | 6 | 10 | 12,696 | 12,761 | 14,643 | 13,331 |
| Off-balance sheet funds (1) (4) | 644 | 504 | - | - | 1,389 | 1,309 | 1,821 | 1,729 |
| Risk-weighted assets | 6,093 | 8,036 | 2,121 | 2,243 | 14,172 | 12,680 | 19,293 | 15,739 |
| Efficiency ratio (%) | 46.9 | 73.7 | 33.0 | 42.1 | 36.2 | 37.1 | 35.8 | 36.0 |
| NPL ratio (%) | 3.4 | 2.0 | 3.9 | 2.8 | 5.3 | 6.0 | 4.1 | 4.0 |
| NPL coverage ratio (%) | 161 | 111 | 91 | 93 | 98 | 100 | 96 | 93 |
| Cost of risk (%) | 4.22 | 1.60 | 2.79 | 0.81 | 1.67 | 2.16 | 1.45 | 0.98 |
- (1) Figures at constant exchange rates.
- (2) Excluding repos.
- (3) Excluding repos and including specific marketable debt securities.
- (4) Includes mutual funds, pension funds and other off-balance-sheet funds.
Activity and results
Unless expressly stated otherwise, all the comments below on rates of change, for both activity and earnings, will be given at constant exchange rates. These rates, together with the changes at current exchange rates, can be found in the attached tables of financial statements and relevant business indicators.
The most relevant aspects related to the area's activity as of December 31, 2019 were:
- Lending activity (performing loans under management) remained above the end of the previous year, increasing by 7.0%. It is important to highlight the evolution of the retail portfolio, which continues to show positive performance especially in credit cards and consumer loans. With regard to asset quality, both the NPL ratio and NPL coverage ratio closed at 4.4% and 100%, respectively, slightly above the end of the previous year.
- On the funding side, deposits from customers under management increased by 6.0% in the year, mainly due to the growth of time deposits and, to a lesser extent, demand deposits. Off-balance sheet funds grew by 10.7% in the same period.
With respect to results, South America generated a cumulative net attributable profit of €721m in 2019, amounting to year-on-year growth of 43.8% (up 24.8% at current exchange rates). The cumulative impact in 2019 of hyperinflation in Argentina on the area's net attributable profit was €-98m.
The most relevant aspects of the income statement are summarized below:
- There was significant income generation from the net interest income, which grew 15.2% in the last twelve months (up 6.2% at current exchange rates).
- Higher contribution from NTI (up 58.1%, up 42.3% at current exchange rates) due to the positive effect derived from Prisma sale in Argentina and the positive contribution of foreign exchange transactions.
- Operating expenses were slightly higher than the previous year (up 1.6%, down 7.9% at current exchange rates).
- Impairment on financial assets increased by 29.4% (up 21.7% at current exchange rates), bringing the cumulative cost of risk to 1.88% as of the end of December 2019.
- Higher provisions (net) and other gains (losses) compared to the previous year (up 83.4%, up 57.8% at current exchange rates).
On homogeneous comparison, i.e. excluding the sale of BBVA Chile that was completed in July 2018, the net attributable profit grew by 40.4% in 2019 at current exchange rates compared to the previous year (+64.0% at constant exchange rates).
The most significant countries in the business area, Argentina, Colombia and Peru, performed as follows in 2019 in terms of activity and earnings:
Argentina
- Lending activity grew by 7.9% explained by the performance of retail loans, mainly due to the increased activity in consumer and credit card portfolios. With regards to asset quality, the NPL ratio increased compared to the last year and stood at 3.4% as of December 31, 2019. Despite this, it continued to perform better than the system and showed a decrease of 30 basis points in the quarter.
- In terms of funding, deposits from customers under management increased by 13.4%, mainly supported by demand deposits, while off-balance sheet funds increased by 27.9%, both compared to December 2018 figures.
- Net attributable profit was €133m, driven mainly by the strong performance of net interest income (due to the increased contribution from securities portfolios and a better customer spread) as well as an increase in NTI (positively impacted by the sale of the stake in Prisma Medios de Pago S.A. in the first quarter of 2019 and to foreign exchange transactions). This performance was negatively impacted by increased operating expenses, which were influenced by high levels of inflation and higher impairments on financial assets explained by the downgrade in the rating and by the situation of the country.
Colombia
- Lending activity grew 6.8% in the year explained by the good performance of the retail portfolio, especially consumer and mortgage loans and of the public sector loans. In terms of asset quality, the NPL ratio fell to 5.3% as of December 2019.
- Deposits from customers under management remained flat compared to the end of 2018.
- The net attributable profit stood at €267m, increasing by of 25.5% year-on-year basis, thanks to the generation of net interest income, the positive performance of the NTI (up 14.1%) due to sales of inflation-linked asset portfolios and the valuation of the security portfolio, lower level of impairments of financial assets and provisions and a lower tax rate, as a result of the court ruling declaring the corporate tax surcharge applicable to financial entities illegal.
Peru
- Lending activity increased by 8.5% compared to the end of 2018 mainly explained by the evolution of the wholesale portfolio and also supported by the strong performance of retail portfolios, especially consumer lending and mortgages. With regards to asset quality, there was an increase in the NPL ratio, to 4.1%, and in NPL coverage ratio, which reached 96%.
- Customer deposits under management increased by 9.8% in the year, mainly due to growth in the time deposits (up 27.0%).
- Good performance in the net interest income, which grew by 7.3% year-on-year due to higher business volumes. The NTI also showed an important increase of 25.6% year-on-year due to foreign exchange transactions. As a result, the net attributable profit stood at €202m, showing a year-on-year growth of 1.9%, offset by higher operating expenses and a higher level of impairments on financial assets.