
Mexico
Highlights
- Good performance of the lending activity, boosted by growth in the retail portfolio.
- Positive trend of customer funds especially in demand deposits.
- Net Interest Income growth in line with activity.
- Excellent performance of the NTI.
- Cumulative cost of risk at historically low levels.
Business activity (1)
(Year-on-year change at constant exchange rate. Data as of 31-12-19)

(1) Excluding repos.
Net interest income/ATAs
(Percentage. Constant exchange rate)

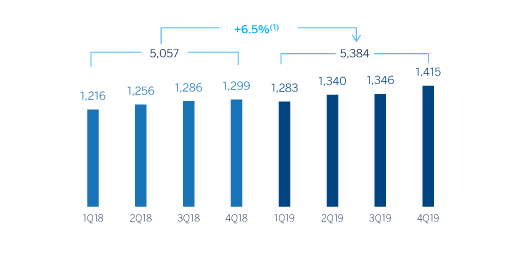
Operating income
(Millions of euros at constant exchange rate)
Net attributable profit
(Millions of euros at constant exchange rate)
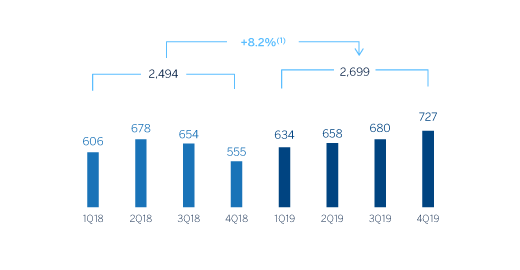
(1) At current exchange rate: +12.2%.
(1) At current exchange rate: +14.0%.
Financial statements and relevant business indicators (Millions of euros and percentage)
| Income statement | 2019 | ∆% | ∆% (1) | 2018 |
|---|---|---|---|---|
| Net interest income | 6,209 | 11.5 | 5.9 | 5,568 |
| Net fees and commissions | 1,298 | 7.8 | 2.3 | 1,205 |
| Net trading income | 310 | 38.7 | 31.7 | 223 |
| Other operating income and expenses | 212 | 7.6 | 2.1 | 197 |
| Gross income | 8,029 | 11.6 | 6.0 | 7,193 |
| Operating expenses | (2,645) | 10.6 | 4.9 | (2,392) |
| Personnel expenses | (1,124) | 9.8 | 4.3 | (1,024) |
| Other administrative expenses | (1,175) | 5.3 | (0.0) | (1,115) |
| Depreciation | (346) | 36.6 | 29.7 | (253) |
| Operating income | 5,384 | 12.2 | 6.5 | 4,800 |
| Impairment on financial assets not measured at fair value through profit or loss | (1,698) | 9.2 | 3.6 | (1,555) |
| Provisions or reversal of provisions and other results | 5 | (80.4) | (81.4) | 24 |
| Profit/(loss) before tax | 3,691 | 12.9 | 7.2 | 3,269 |
| Income tax | (992) | 10.0 | 4.4 | (901) |
| Profit/(loss) for the year | 2,699 | 14.0 | 8.2 | 2,368 |
| Non-controlling interests | (0) | 14.1 | 8.3 | (0) |
| Net attributable profit | 2,699 | 14.0 | 8.2 | 2,367 |
| Balance sheets | 31-12-19 | ∆% | ∆% (1) | 31-12-18 |
|---|---|---|---|---|
| Cash. cash balances at central banks and other demand deposits | 6,489 | (21.6) | (26.0) | 8,274 |
| Financial assets designated at fair value | 31,402 | 20.7 | 13.9 | 26,022 |
| Of which loans and advances | 777 | n.s. | n.s. | 72 |
| Financial assets at amortized cost | 66,180 | 14.7 | 8.2 | 57,709 |
| Of which loans and advances to customers | 58,081 | 13.7 | 7.2 | 51,101 |
| Tangible assets | 2,022 | 13.1 | 6.7 | 1,788 |
| Other assets | 2,985 | (18.0) | (22.6) | 3,639 |
| Total assets/liabilities and equity | 109,079 | 12.0 | 5.6 | 97,432 |
| Financial liabilities held for trading and designated at fair value through profit or loss | 21,784 | 20.8 | 14.0 | 18,028 |
| Deposits from central banks and credit institutions | 2,117 | 209.9 | 192.3 | 683 |
| Deposits from customers | 55,934 | 10.7 | 4.4 | 50,530 |
| Debt certificates | 8,840 | 3.2 | (2.6) | 8,566 |
| Other liabilities | 15,514 | 0.2 | (5.5) | 15,485 |
| Economic capital allocated | 4,889 | 18.1 | 11.4 | 4,140 |
| Relevant business indicators | 31-12-19 | ∆% | ∆% (1) | 31-12-18 |
|---|---|---|---|---|
| Performing loans and advances to customers under management (2) | 58.617 | 14,1 | 7,6 | 51.387 |
| Non-performing loans | 1.478 | 29,9 | 22,5 | 1.138 |
| Customer deposits under management (2) | 55.331 | 11,2 | 4,9 | 49.740 |
| Off-balance sheet funds (3) | 24.464 | 18,5 | 11,8 | 20.647 |
| Risk-weighted assets | 59.299 | 11,5 | 5,2 | 53.177 |
| Efficiency ratio (%) | 32,9 | 33,3 | ||
| NPL ratio (%) | 2,4 | 2,1 | ||
| NPL coverage ratio (%) | 136 | 154 | ||
| Cost of risk (%) | 3,01 | 3,07 |
(1) Figures at constant exchange rate.
(2) Excluding repos.
(3) Includes mutual funds, pension funds and other off-balance sheet funds.
Activity
Unless expressly stated otherwise, all the comments below on rates of change, for both activity and earnings, will be given at constant exchange rates. These rates, together with changes at constant exchange rates, can be found in the attached tables of financial statements and relevant business indicators.
The most relevant aspects related to the area's activity in 2019 have been:
- Lending activity (performing loans under management) showed a strong dynamism in the final quarter of the year, with growth of 1.7% that boosted the year-on-year variation to 7.6%. It can be seen that even when economic uncertainty was observed throughout the year and there was a slowdown in credit growth in the system, BBVA managed to maintain its leadership position in Mexico, with a market share of 22.8% in performing loans, according to local figures from the National Banking and Securities Commission (CNBV) at the end of November 2019.
- The wholesale portfolio, showed an increase of 5.1% year on year, driven mainly by the positive performance of business loans which grew by 3.9% in 2019. It should be noted the positive performance of the corporate banking portfolio in the quarter, which managed to reverse the downward trend observed until September to end the year with a positive growth compared to 2018. The retail portfolio maintained the dynamism shown throughout 2019 and closed the year with a year-on-year growth rate of 8.1%, strongly supported by consumer loans (payroll and those loans used for the purchase of cars, mainly) and mortgages (up 13.1% and up 10.5% respectively, compared to December 2018). This portfolio also showed a double-digit year-on-year growth rate in the new loan production.
- In terms of asset quality indicators, the NPL ratio stood at 2.4% while NPL coverage ratio stood at 136%.
- Total customer funds (customer deposits under management, mutual funds and other off-balance sheet funds) grew by 7.0%, despite the highly competitive market. The rise can be explained by an increase in the demand deposits (up 6.2%), and the positive evolution of mutual funds (up 16.7%), driven by the wide range of these type of investment products. Regarding the funding mix, demand deposits represent 80% of the total customer deposits under management at the end of 2019.
Results
BBVA in Mexico achieved a net attributable profit of €2,699m in 2019, up 8.2% year-on-year. The most relevant aspects related to the income statement are summarized below:
- The strong performance of the net interest income, with a year-on-year growth of 5.9%, driven by higher income from the retail portfolio.
- Net fees and commissions grew by 2.3%, despite the strong pressures from the competitive environment. This evolution is mainly explained by the increase in the credit card billing from customers.
- NTI showed an excellent performance, with a 31.7% year-on-year growth derived mainly from the gains coming from portfolio sales.
- Other operating income and expenses increased by 2.1% year-on-year, resulting from higher earnings in the insurance business and despite the higher contribution to the Deposit Guarantee Fund.
- Gross income grew by 6.0% in year-on-year terms, exceeding the increase in operating expenses (up 4.9%) which, despite being heavily influenced by the increase in the contribution to the Foundation, follow a strict cost control policy. As a result, the efficiency ratio improved in 2019 to 32.9%.
- The impairment on financial assets line increased by 3.6% mainly due to the higher requirement derived from the greater dynamism observed in the retail portfolio, and the negative impact of the deterioration in the macro scenario. Despite all of the above, the cumulative cost of risk stood at 3.01% in 2019, which is the lowest level of the last nine years.
- In the provisions (net) and other gains (losses) line, the comparison was negative due to extraordinary income in the first half of 2018 from the sale of holdings in real estate developments by BBVA in Mexico.