
The United States
Highlights
- Activity impacted by Fed’s interest-rate cuts.
- Good performance of net fees and commissions and NTI.
- Continued improvement of the efficiency ratio.
- Net attributable profit affected by the impairment on financial assets.
Business activity (1)
(Year-on-year change at constant exchange rate. Data as of 31-12-19)

(1) Excluding repos.
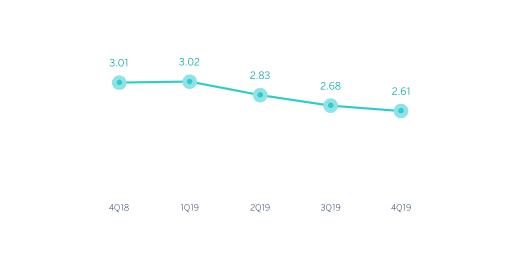
Net interest income/ATAs
(Percentage. Constant exchange rate)
Operating income
(Millions of euros at constant exchange rate)
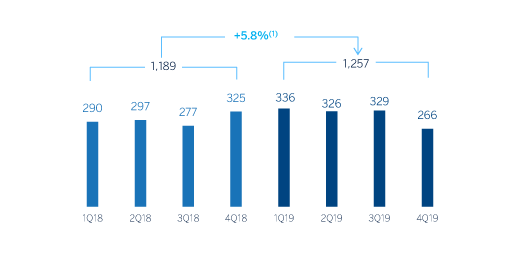
(1) At current exchange rate: +11.4%.
Net attributable profit
(Millions of euros at constant exchange rate)
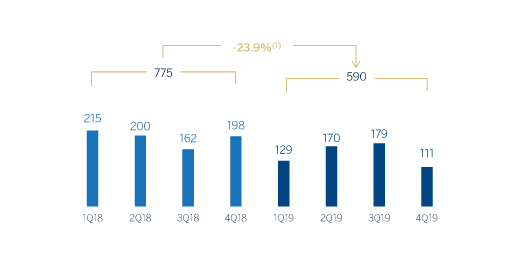
(1) At current exchange rate: -19.9%.
Financial statements and relevant business indicators
(Millions of euros and percentage)
| Income statement | 2019 | ∆% | ∆% (1) | 2018 |
|---|---|---|---|---|
| Net interest income | 2,395 | 5.2 | (0.2) | 2,276 |
| Net fees and commissions | 644 | 8.1 | 2.6 | 596 |
| Net trading income | 173 | 58.8 | 51.6 | 109 |
| Other operating income and expenses | 12 | 31.7 | 29.3 | 9 |
| Gross income | 3,223 | 7.8 | 2.3 | 2,989 |
| Operating expenses | (1,966) | 5.7 | 0.3 | (1,861) |
| Personnel expenses | (1,126) | 7.2 | 1.7 | (1,051) |
| Other administrative expenses | (621) | (1.7) | (6.7) | (632) |
| Depreciation | (219) | 23.1 | 16.8 | (178) |
| Operating income | 1,257 | 11.4 | 5.8 | 1,129 |
| Impaiment on financial assets not measured at fair value through profit or loss | (550) | 144.9 | 132.3 | (225) |
| Provisions or reversal of provisions and other results | (2) | n.s. | n.s. | 16 |
| Profit/(loss) before tax | 705 | (23.4) | (27.3) | 920 |
| Income tax | (115) | (37.7) | (40.8) | (185) |
| Profit/(loss) for the year | 590 | (19.9) | (23.9) | 736 |
| Non-controlling interests | - | - | - | - |
| Net attributable profit | 590 | (19.9) | (23.9) | 736 |
| Balance sheets | 31-12-19 | ∆% | ∆%(1) | 31-12-18 |
|---|---|---|---|---|
| Cash. cash balances at central banks and other demand deposits | 8,293 | 71.5 | 68.3 | 4,835 |
| Financial assets designated at fair value | 7,659 | (26.9) | (28.3) | 10,481 |
| Of which: Loans and advances | 261 | 67.1 | 63.9 | 156 |
| Financial assets at amortized cost | 69,510 | 9.4 | 7.3 | 63,539 |
| Of which: Loans and advances to customers | 63,162 | 3.9 | 1.9 | 60,808 |
| Inter-area positions | - | - | - | - |
| Tangible assets | 914 | 36.7 | 34.2 | 668 |
| Other assets | 2,153 | (15.0) | (16.6) | 2,534 |
| Total assets/liabilities and equity | 88,529 | 7.9 | 5.9 | 82,057 |
| Financial liabilities held for trading and designated at fair value through profit or loss | 282 | 20.2 | 18.0 | 234 |
| Deposits from central banks and credit institutions | 4,081 | 21.1 | 18.8 | 3,370 |
| Deposits from customers | 67,525 | 5.7 | 3.7 | 63,891 |
| Debt certificates | 3,551 | (1.4) | (3.2) | 3,599 |
| Inter-area positions | 3,416 | 77.3 | 74.0 | 1,926 |
| Other liabilities | 5,831 | 3.1 | 1.2 | 5,654 |
| Economic capital allocated | 3,843 | 13.6 | 11.5 | 3,383 |
| Relevant business indicators | 31-12-19 | ∆% | ∆% (1) | 31-12-18 |
|---|---|---|---|---|
| Performing loans and advances to customers under management (2) | 63,241 | 4.0 | 2.1 | 60,784 |
| Non-performing loans | 730 | (9.0) | (10.7) | 802 |
| Customer deposits under management (2) | 67.,528 | 5.7 | 3.7 | 63,888 |
| Off-balance sheet funds (3) | - | - | - | - |
| Risk-weighted assets | 65,170 | 1.5 | (0.4) | 64,175 |
| Efficiency ratio (%) | 61.0 | 62.2 | ||
| NPL ratio (%) | 1.1 | 1.3 | ||
| NPL coverage ratio (%) | 101 | 85 | ||
| Cost of risk (%) | 0.88 | 0.39 |
- (1) Figures at constant exchange rate.
- (2) Excluding repos.
- (3) Includes mutual funds, pension funds and other off-balance-sheet funds.
Activity
Unless expressly stated otherwise, all the comments below on rates of change, for both activity and earnings, will be given at constant exchange rates. These rates, together with the changes at the current exchange rates, can be found in the attached tables of financial statements and relevant business indicators.
The most relevant aspects related to the area's activity in 2019 were as follows:
- Lending activity (performing loans under management) increased quarter-over-quarter and year-on-year (up 3.0% and up 2.1%, respectively), mainly due to the dynamism of the corporate banking and commercial portfolio. The retail portfolio remained practically flat during 2019 (down 0.9%), with slight declines in the mortgage and consumer portfolios, which were partially offset by the increase in credit cards, mainly due to BBVA’s commercial effort to promote this product amongst its clients.
- With regard to the risk indicators, there was a significant reduction in non-performing loans in the quarter that caused the NPL ratio to stand at 1.1% at year end. The NPL coverage ratio improved to 101%.
- Customer deposits under management increased 3.7% year-on-year, explained by an increase in demand deposits (+10.6%), which offset the decrease in term deposits (-15.4%).
Results
The United States generated a net attributable profit of €590m during 2019, which is 23.9% lower than the previous year as a result of the increase in the impairment of financial assets. The most relevant aspects related to the income statement are summarized below:
- The net interest income was stable during the year, since the good performance during the first half of the year was hampered by the Fed rate cuts in the second half of the year. This line decreased 2.1% in the last quarter of the year.
- Net fees and commissions increased 2.6% in the year mainly due to the increase in those fees and commissions related to investment banking, cards, commercial establishments and, to a lesser extent, those associated with syndicated loans.
- Significant increase in NTI (up 51.6% in the year) as a result of greater capital gains from the sale of ALCO portfolios.
- Operating expenses remained stable (up 0.3%) in 2019.
- There was an increase in the impairment of financial assets during 2019 (up 132.3%), due to provisions for specific commercial portfolio customers, more write-offs in the consumer portfolio and an adjustment in the macro scenario. In addition, the comparison was affected by the release in 2018 of hurricane-related provisions from the previous year. Consequently, the cumulative cost of risk as of December 2019 increased to 0.88%, compared with 0.39% as of December 2018.