
Spain
Highlights
- Growth in consumer, retail and commercial portfolios.
- Net Interest income influenced by the impact of IFRS 16.
- Continued decrease in operating expenses.
- Positive impact of the sale of non-performing and write-off portfolios on loan loss provisions and risk indicators.
Business activity (1)
(Year-on-year change. Data as of 31-12-19)
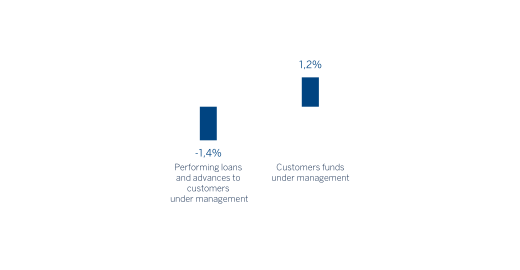
(1) Excluding repos.
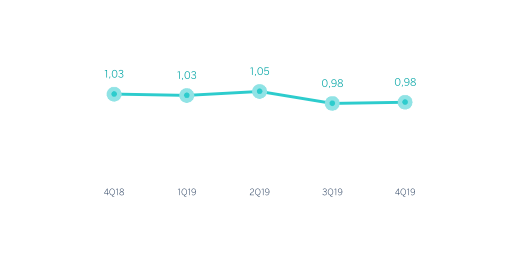
Net interest income/ATAs
(Percentage)
Operating income (Millions of euros)

Net attributable profit (Millions of euros)

Financial statements and relevant business indicators (Millions of euros and percentage)
| Income statement | 2019 | ∆% | 2018 |
|---|---|---|---|
| Net interest income | 3,645 | (1.4) | 3,698 |
| Net fees and commissions | 1,751 | 4.1 | 1,682 |
| Net trading income | 239 | (54.9) | 529 |
| Other operating income and expenses | 98 | 65.2 | 59 |
| Of which insurance activities (1) | 518 | 6.7 | 485 |
| Gross income | 5,734 | (3.9) | 5,968 |
| Operating expenses | (3,253) | (2.4) | (3,335) |
| Personnel expenses | (1,883) | 0.1 | (1,880) |
| Other administrative expenses | (895) | (22.0) | (1,147) |
| Depreciation | (476) | 54.8 | (308) |
| Operating income | 2,480 | (5.8) | 2,634 |
| Impairment on financial assets not measured at fair value through profit or loss | (216) | (43.6) | (383) |
| Provisions or reversal of provisions and other results | (386) | (5.9) | (410) |
| Profit/(loss) before tax | 1,878 | 2.1 | 1,840 |
| Income tax | (489) | 12.0 | (437) |
| Profit/(loss) for the year | 1,389 | (1.0) | 1,403 |
| Non-controlling interests | (3) | (16.0) | (3) |
| Net attributable profit | 1,386 | (1.0) | 1,400 |
- (1) Includes premiums received net of estimated technical insurance reserves.
| Balance sheets | 31-12-19 | ∆% | 31-12-18 |
|---|---|---|---|
| Cash, cash balances at central banks and other demand deposits | 15,903 | (44.3) | 28,545 |
| Financial assets designated at fair value | 122,844 | 14.5 | 107,320 |
| Of which: Loans and advances | 34,175 | 13.1 | 30,222 |
| Financial assets at amortized cost | 195,269 | (0.1) | 195,467 |
| Of which: Loans and advances to customers | 167,341 | (1.8) | 170,438 |
| Inter-area positions | 21,621 | 54.2 | 14,026 |
| Tangible assets | 3,302 | 155.2 | 1,294 |
| Other assets | 6,436 | (22.0) | 8,249 |
| Total assets/liabilities and equity | 365,374 | 3.0 | 354,901 |
| Financial liabilities held for trading and designated at fair value through profit or loss | 78,684 | 10.8 | 71,033 |
| Deposits from central banks and credit institutions | 41,092 | (10.5) | 45,914 |
| Deposits from customers | 182,370 | (0.6) | 183,414 |
| Debt certificates | 35,523 | 13.3 | 31,352 |
| Inter-area positions | - | - | - |
| Other liabilities | 18,484 | 27.3 | 14,519 |
| Economic capital allocated | 9,220 | 6.3 | 8,670 |
| Relevant business indicators | 31-12-19 | ∆% | 31-12-18 |
|---|---|---|---|
| Performing loans and advances to customers under management (1) | 164,150 | (1.4) | 166,396 |
| Non-performing loans | 8,635 | (14.3) | 10,073 |
| Customer deposits under management (1) | 182,370 | (0.3) | 182,984 |
| Off-balance sheet funds (2) | 66,068 | 5.6 | 62,559 |
| Risk-weighted assets | 104,925 | 0.8 | 104,113 |
| Efficiency ratio (%) | 56.7 | 55.9 | |
| NPL ratio (%) | 4.4 | 5.1 | |
| NPL coverage ratio (%) | 60 | 57 | |
| Cost of risk (%) | 0.12 | 0.21 |
- (1) Excluding repos.
- (2) Includes mutual funds, pension funds and other off-balance-sheet funds.
Activity
The most relevant aspects related to the area's activity in 2019 have been:
- At the end of 2019, lending activity (performing loans under management) was lower year-on-year (down 1.4%), with a reduction in mortgage loans and in the institutional and corporate portfolios (-3.2%, -10.4% and -5.1%, respectively), partially offset by consumer growth (including credit cards, up 15.8%) as well as retail and medium-sized businesses ( up 3.4% and up 6.4% year-on-year, respectively).
- In asset quality, the reduction in non-performing loan balances continued over the quarter, with a positive effect on the area's NPL ratio, which fell by 66 basis points along the year to stand at 4.4% as of December 31, 2019 (5.1% as of December 31, 2018). This evolution was mainly the result of the sale of non-performing and write-offs loan portfolios in 2019, as well as a lower level of non-performing loans in mortgage portfolios. The NPL coverage ratio was 60%, up from the figure at the end of 2018 (57%).
- Customer deposits under management stayed flat during the year (down 0,3%) and showed an increase in the last quarter (up 1.0%) as a result of the evolution of demand deposits (up 1.5%), which managed to offset the fall in time deposits (down 1.8%).
- Off-balance sheet funds showed a positive evolution (up 5.6% since December 31, 2018), in both mutual and pension funds.
Results
The 2019 net attributable profit generated by BBVA in Spain was €1,386m, slightly below the same period of the previous year (down 1.0%).
The main highlights of the area's income statement are:
- The net interest income registered a slight increase in the quarter (up 1.3%) that allowed the annual rate of decline to decrease (-1.4%, compared to -1.9% year-on-year at the end of September 2019). This is mainly due to the smaller contribution from the ALCO portfolios and the effect of IFRS 16, which entered into force on January 1, 2019.
- Net fees and commissions also evolved very positively in the quarter (up 5.0%), mainly due to corporate banking operations, and also due to the good performance of the commissions charged for asset management. In the year, they increased by 4.1%.
- In the NTI line, the quarterly evolution was very notable, which did not manage to offset the smaller contribution compared to the previous year (down 54.9%) due to the irregular behavior of the markets in 2019, as well as the lower portfolio sales.
- The evolution of other income and operating expenses improved significantly compared to 2018 (up 65.2%) despite the increase to The Deposit Guarantee Fund in the last quarter of 2019, and thanks to the positive evolution of net insurance earnings and the lower costs associated with the real estate business, which are also included in this line of the income statement.
- The excellent trend in operating expenses (down 2.4% year-on-year) continued as a result of the cost reduction plans. As a result, the efficiency ratio stood at 56.7%.
- The impairment on financial assets fell compared to 2018, helped by the positive effect of the sale of non-performing and written-off mortgage loan portfolios in the year.
- Finally, provisions and other results closed at €-386m, or 5.9% lower than the previous year.