
Turkey
Highlights
- In Turkish lira, positive activity performance and relevant improvement in the spread.
- Operating expenses growth below the inflation rate.
- Positive evolution of net fees and commissions and lower requirements for loan-loss provisions on financial assets.
Business activity (1)
(Year-on-year change at constant exchange rate. Data as of 31-12-19)
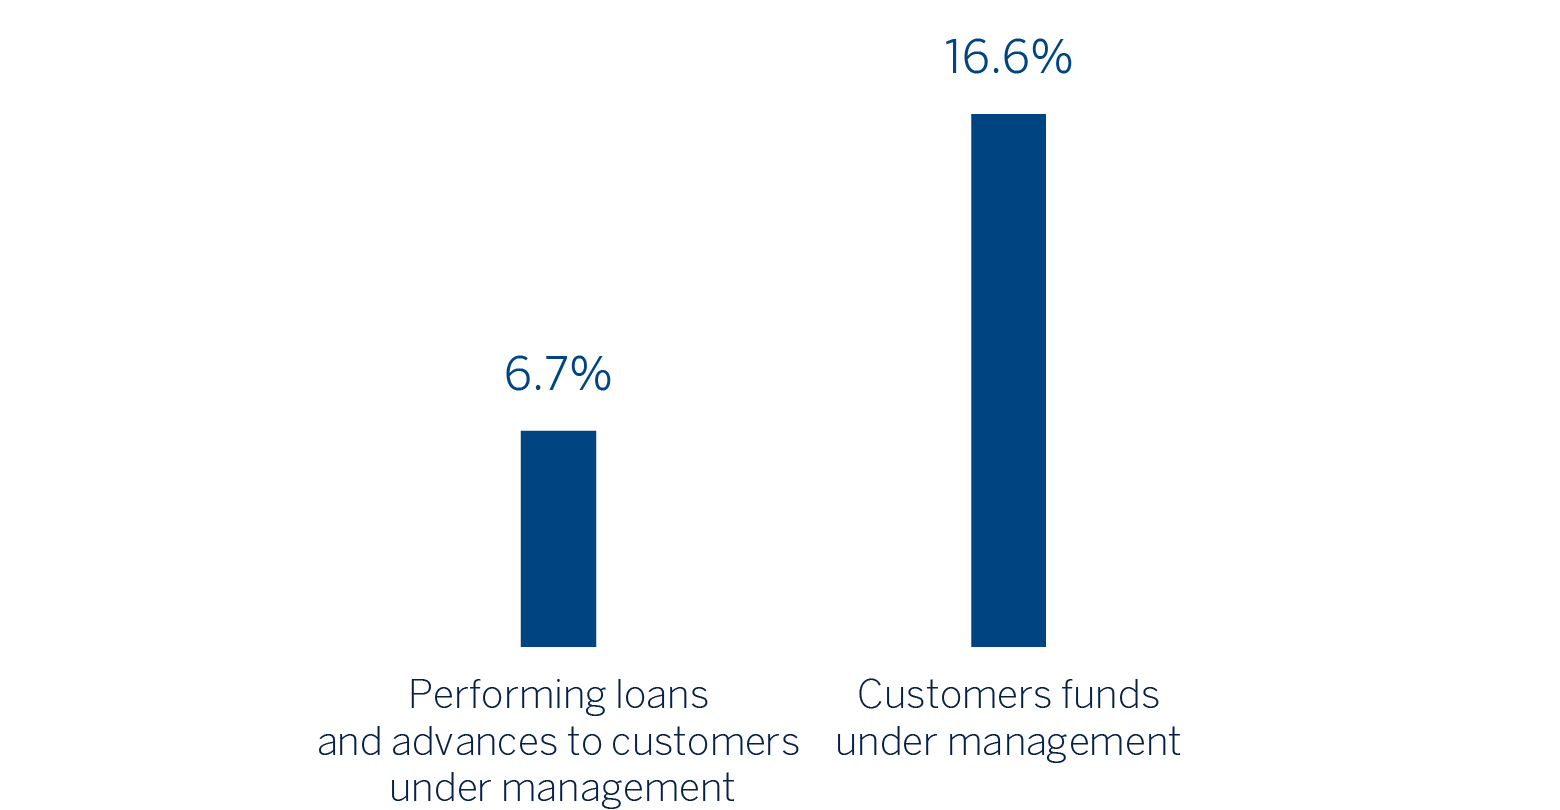
(1) Excluding repos.
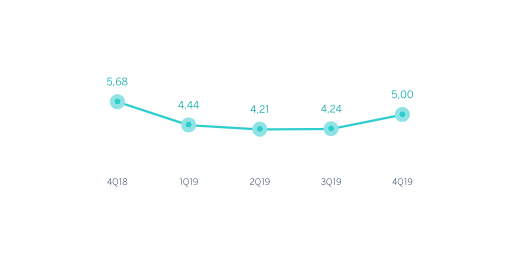
Net interest income/ATAs
(Percentage. Constant exchange rate)
Operating income
(Millions of euros at constant exchange rate)
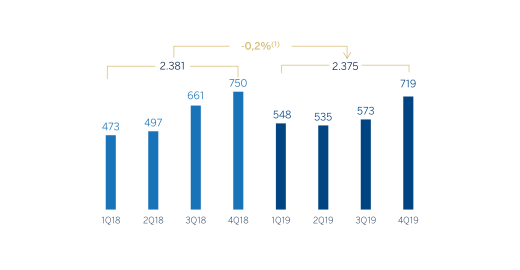
(1) At current exchange rate: -10.5%.
Net attributable profit
(Millions of euros at constant exchange rate)

(1) At current exchange rate: -10.7%
Financial statements and relevant business indicators (Millions of euros and percentage)
| Income statement | 2019 | ∆% | ∆% (1) | 2018 |
|---|---|---|---|---|
| Net interest income | 2,814 | (10.2) | 0.1 | 3,135 |
| Net fees and commissions | 717 | 4.5 | 16.5 | 686 |
| Net trading income | 10 | (11.7) | (1.6) | 11 |
| Other operating income and expenses | 50 | (28.7) | (20.5) | 70 |
| Gross income | 3,590 | (8.0) | 2.6 | 3,901 |
| Operating expenses | (1,215) | (2.6) | 8.6 | (1,247) |
| Personnel expenses | (678) | 3.3 | 15.2 | (656) |
| Other administrative expenses | (359) | (20.8) | (11.8) | (453) |
| Depreciation | (179) | 29.3 | 44.1 | (138) |
| Operating income | 2,375 | (10.5) | (0.2) | 2,654 |
| Impairment on financial assets not measured at fair value through profit or loss | (906) | (24.6) | (16.0) | (1,202) |
| Provisions or reversal of provisions and other results | (128) | n.s. | n.s. | (8) |
| Profit/(loss) before tax | 1,341 | (7.1) | 3.5 | 1,444 |
| Income tax | (312) | 6.5 | 18.7 | (293) |
| Profit/(loss) for the year | 1,029 | (10.6) | (0.3) | 1,151 |
| Non-controlling interests | (524) | (10.4) | (0.2) | (585) |
| Net attributable profit | 506 | (10.7) | (0.5) | 567 |
| Balance sheets | 31-12-19 | ∆% | ∆% (1) | 31-12-18 |
|---|---|---|---|---|
| Cash. cash balances at central banks and other demand deposits | 5,486 | (30.1) | (22.9) | 7,853 |
| Financial assets designated at fair value | 5.268 | (4.3) | 5.6 | 5,506 |
| Of which loans and advances | 444 | 8.4 | 19.6 | 410 |
| Financial assets at amortized cost | 51,285 | 1.9 | 12.5 | 50,315 |
| Of which loans and advances to customers | 40,500 | (2.4) | 7.7 | 41,478 |
| Tangible assets | 1,117 | 5.5 | 16.4 | 1,059 |
| Other assets | 1,260 | (16.9) | (8.4) | 1,517 |
| Total assets/liabilities and equity | 64,416 | (2.8) | 7.3 | 66,250 |
| Financial liabilities held for trading and designated at fair value through profit or loss | 2,184 | 17.9 | 30.1 | 1,852 |
| Deposits from central banks and credit institutions | 4,473 | (33.6) | (26.7) | 6,734 |
| Deposits from customers | 41,335 | 3.6 | 14.3 | 39,905 |
| Debt certificates | 4,271 | (28.4) | (21.0) | 5,964 |
| Other liabilities | 9,481 | 2.3 | 12.9 | 9,267 |
| Economic capital allocated | 2,672 | 5.7 | 16.6 | 2,529 |
| Relevant business indicators | 31-12-19 | ∆% | ∆% (1) | 31-12-18 |
|---|---|---|---|---|
| Performing loans and advances to customers under management (2) | 39,662 | (3.3) | 6.7 | 40,996 |
| Non-performing loans | 3,663 | 27.4 | 40.5 | 2,876 |
| Customer deposits under management (2) | 41,324 | 3.6 | 14.3 | 39,897 |
| Off-balance sheet funds (3) | 3,906 | 35.0 | 48.9 | 2,894 |
| Risk-weighted assets | 56,642 | 0.3 | 10.6 | 56,486 |
| Efficiency ratio (%) | 33.8 | 32.0 | ||
| NPL ratio (%) | 7.0 | 5.3 | ||
| NPL coverage ratio (%) | 75 | 81 | ||
| Cost of risk (%) | 2.07 | 2.44 |
(1) Figures at constant exchange rate.
(2) Excluding repos.
(3) Includes mutual funds, pension funds and other off-balance-sheet funds.
Activity
Unless expressly stated and communicated otherwise, rates of changes explained ahead, both for activity and for income, will be presented at constant exchange rates. These rates, together with changes at current exchange rates, can be observed in the attached tables of the financial statements and relevant business indicators.
The most relevant aspects related to the area’s activity year-to-date as of December 31, 2019 were:
- Lending activity (performing loans under management) rose by 6.7% year-to-date (up 8.2% in quarterly terms) mainly driven by Turkish Lira loan growth. Significant performance of Turkish Lira loans in the last quarter of 2019 by 6.6% where foreign currency loans remained stable after the contraction in the first nine months of 2019 (in U.S. dollar terms).
- Turkish Lira commercial loans grew year-to-date thanks to a strong performance in the first quarter supported by the Credit Guarantee Fund (CGF) utilization and short term corporate loans. In addition, consumer loans expanded in year-on-year terms of, explained by the improvement in the last quarter of the year mainly driven by the General Purpose Loans and thanks to the declining interest rate environment. Additionally, credit cards continued to show solid performance on a year-on-year basis.
- In terms of asset quality, the NPL ratio slightly decreased to 7.0% from 7.2% as of September 30, 2019. The NPL coverage ratio stands at 75% December 31, 2019.
- Customer deposits under management (64% of total liabilities in the area as of December 31, 2019) remained the main source of funding for the balance sheet and increased by 14.3% on a year-on-year basis. It is worth mentioning the good performance of demand deposits, which increased by 38.6% year-on-year and 12.3% in the last quarter. Demand deposits share in total deposits is 38.1%.
Results
Turkey generated a net attributable profit of €506m in 2019 representing a flattish year-on-year evolution (down 0.5%). The net attributable profit of this business area in the fourth quarter increased by 31.5%. The most significant aspects of the year-on-year evolution in the income statement are the following:
- Net interest income remains stable mainly thanks to the successful price management that led to increase in both Turkish Lira and Foreign currency spreads offset by a sharp reduction in inflation-linked bonds contribution.
- Income from net fees and commissions grew by 16.5%. This significant increase was mainly driven by the positive performance in payment systems and backed by money transfers and non-cash loans.
- Flat NTI despite the unfavorable market conditions.
- Gross income grew by 2.6% in 2019 compared to 2018, thanks to the increase in core banking revenues.
- Impairment on financial assets declined by 16.0% on a year-on-year basis due to lower negative impacts from the macro scenario update and higher big ticket provisions coming from the wholesale-customer portfolio in 2018. As a result, the cumulative cost of risk of the area stood at 2.07%.
- Provisions or reversal of provisions and other results subtracts €128m versus €8m in 2018 due to higher provisions for contingent liabilities and commitments.