Other information: Corporate & Investment Banking
Highlights
- Good performance of customer activity affecting positively the net interest income and fees and commissions.
- Leadership position in green and sustainable loans.
- Net attributable profit affected by the significant increase in the impairment on financial assets line.
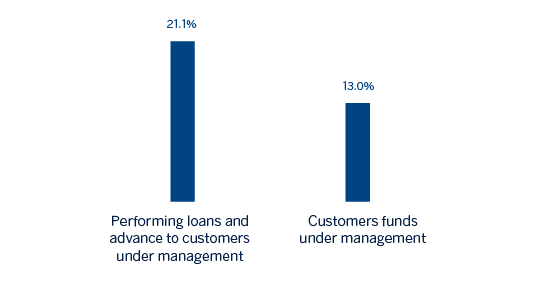
Business activity (1)
(Year-on-year change at constant exchange rates. Data as of 31-03-20)

(1) Excluding repos.
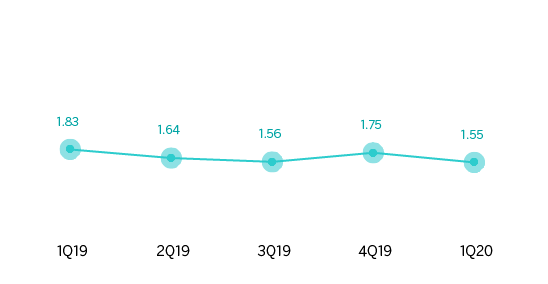
Gross income/ATAs
(Percentage. Constant exchange rates)

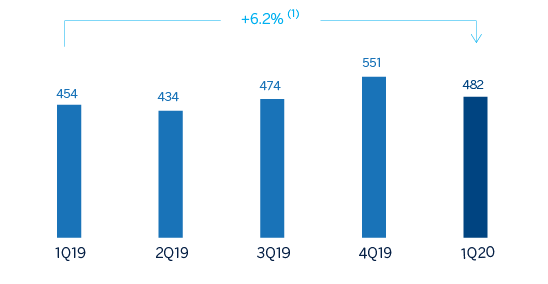
Operating income
(Millions of euros at constant exchange rates)

(1) At current exchange rate: +0.6%.
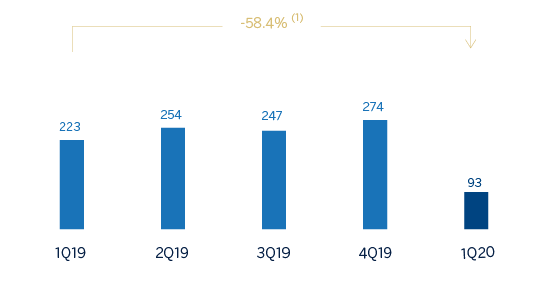
Net attributable profit
(Millions of euros at constant exchange rates)

(1) At current exchange rate: -60.4%.
Financial statements and relevant business indicators (Millions of euros and percentage)
| Income statement | 1Q 2020 | ∆% | ∆% (1) | 1Q 2019 |
|---|---|---|---|---|
| Net interest income | 389 | 5.9 | 10.6 | 367 |
| Net fees and commissions | 196 | 13.4 | 16.7 | 173 |
| Net trading income | 182 | (15.4) | (11.4) | 215 |
| Other operating income and expenses | (13) | (13.2) | (7.3) | (15) |
| Gross income | 754 | 1.8 | 6.0 | 740 |
| Operating expenses | (272) | 4.1 | 5.8 | (261) |
| Personnel expenses | (125) | 3.8 | 4.7 | (120) |
| Other administrative expenses | (117) | 7.2 | 10.3 | (109) |
| Depreciation | (30) | (5.5) | (5.4) | (32) |
| Operating income | 482 | 0.6 | 6.2 | 479 |
| Impairment on financial assets not measured at fair value through profit or loss | (311) | n.s. | n.s. | (55) |
| Provisions or reversal of provisions and other results | (11) | n.s. | n.s. | 5 |
| Profit/(loss) before tax | 160 | (62.5) | (60.3) | 428 |
| Income tax | (44) | (59.2) | (56.9) | (107) |
| Profit/(loss) for the year | 117 | (63.7) | (61.4) | 321 |
| Non-controlling interests | (24) | (72.4) | (69.9) | (87) |
| Net attributable profit | 93 | (60.4) | (58.4) | 234 |
- (1) Figures at constant exchange rates.
| Balance sheets | 31-03-20 | ∆% | ∆% (1) | 31-12-19 |
|---|---|---|---|---|
| Cash, cash balances at central banks and other demand deposits | 5,952 | 69.4 | 67.3 | 3,513 |
| Financial assets designated at fair value | 138,068 | 31.0 | 34.8 | 105,386 |
| Of which Loans and advances | 42,896 | 25.6 | 25.8 | 34,153 |
| Financial assets at amortized cost | 87,370 | 14.7 | 19.5 | 76,169 |
| Of which loans and advances to customers | 74,561 | 13.1 | 17.8 | 65,915 |
| Inter-area positions | - | - | - | - |
| Tangible assets | 57 | (9.6) | (5.4) | 63 |
| Other assets | 1,641 | (34.5) | (37.5) | 2,506 |
| Total assets/liabilities and equity | 233,090 | 24.2 | 28.2 | 187,637 |
| Financial liabilities held for trading and designated at fair value through profit or loss | 119,659 | 30.5 | 34.2 | 91,657 |
| Deposits from central banks and credit institutions | 19,484 | 26.3 | 27.6 | 15,426 |
| Deposits from customers | 40,931 | 4.5 | 10.4 | 39,166 |
| Debt certificates | 2,183 | (16.8) | (13.6) | 2,625 |
| Inter-area positions | 42,320 | 35.1 | 38.4 | 31,316 |
| Other liabilities | 3,817 | 29.0 | 34.0 | 2,959 |
| Economic capital allocated | 4,696 | 4.7 | 9.5 | 4,487 |
- (1) Figures at constant exchange rates.
| Relevant business indicators | 31-03-20 | ∆% | ∆% (1) | 31-12-19 |
|---|---|---|---|---|
| Performing loans and advances to customers under management (2) | 74,386 | 13.6 | 18.3 | 65,509 |
| Non-performing loans | 1,093 | (9.8) | (5.4) | 1,211 |
| Customer deposits under management (2) | 40,607 | 3.7 | 9.6 | 39,150 |
| Off-balance sheet funds (3) | 724 | (30.2) | (19.0) | 1.037 |
| Efficiency ratio (%) | 36.1 | 35.2 |
- (1) Figures at constant exchange rates.
- (2) Excluding repos.
- (3) Includes mutual funds. pension funds and other off-balance sheet funds.
Activity
Unless expressly stated otherwise, all the comments below on rates of change, for both activity and profit and loss, will be given at constant exchange rates. These rates, together with changes at current exchange rates, can be found in the attached tables of the financial statements and relevant business indicators.
The most relevant aspects related to the area's activity during the first quarter of 2020 have been:
- Lending activity (performing loans under management) grew by 18.3% between January and March 2020. By geographical area, the comparison in the United States, Mexico, Turkey and the Rest of Eurasia was more favorable. It is noteworthy that at the end of March 2020, activity has not yet been affected by the negative effects of COVID-19.
- Customer funds increased 8.9% in the first quarter of 2020, mainly due to the performance in Mexico, the United States and Spain.
- BBVA was one of the most active financial institutions in sustainable finance in 2019, having participated in a total of 47 green transactions and/or transactions linked to sustainability criteria (ESG scores, environmental and social KPIs), certified by renowned independent consultants. Of these 47 transactions, including syndicated loans (36 transactions) and bilateral loans (11 transactions), 23 were led by BBVA as the sustainable coordinator. This leadership of BBVA materialized in relevant transactions in countries such as Spain, the United Kingdom, France, Portugal, Belgium, Mexico and China, and in various sectors including hospitality, energy (gas and electricity), recycling and automotive components, among others.
- At the end of the first quarter of 2020, BBVA continued to maintain its activity in the field of sustainable financing with stakes in seven transactions with these characteristics, leading two of them as the sustainable coordinator.
Results
CIB generated a net attributable profit of €93m euros in the first quarter of 2020, which is 58.4% less than in the first quarter of 2019. This is due to the increase in the impairment on financial assets, as the operating income grew 6.2% over the same period of time. The most relevant aspects of the year-on-year changes in the income statement are summarized below:
- Positive performance of net interest income (up 10.6%) linked to the activity and an improvement in the customer spreads during the first quarter.
- Increase in net fees and commissions (up 16.7%), supported by transactional business and investment, and finance banking in most geographic areas. NTI closed lower compared to the same period of 2019 (down 11.4%) due to the market turbulences caused by COVID-19. This is despite the positive developments in customer activity, foreign exchange transactions and placement of bonds.
- Operating expenses increased 5.8% year-on-year, mainly due to the growing inflation in emerging countries and investments in technology projects.
- Provisions for the impairment on financial assets increased significantly, mainly due to the deterioration of the macroeconomic scenario as a result of COVID-19, and amounted to €193m.
