
Spain
Highlights
- Positive evolution in the consumer and corporate banking portfolios in the quarter.
- Year-on-year growth in recurring income.
- Reduction of operating expenses.
- Net attributable profit affected by the significant increase in the impairment on financial assets line.
Business activity (1)
(Year-on-year change. Data as of 31-03-20)
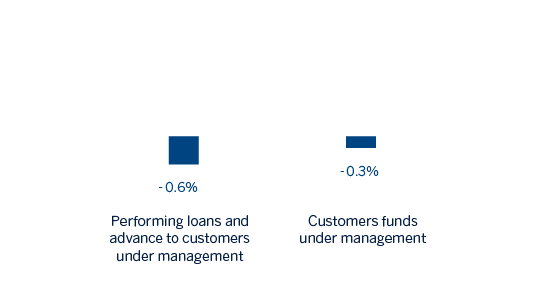
(1) Excluding repos.
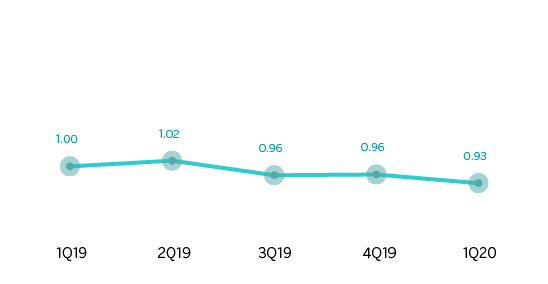
Net interest income/ATAs
(Percentage)
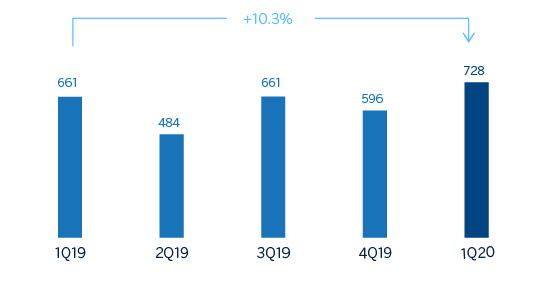
Operating income (Millions of euros)
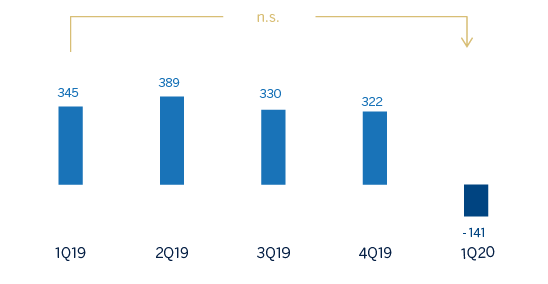
Net attributable profit (Millions of euros)
Financial statements and relevant business indicators (Millions of euros and percentage)
| Income statement | 1Q20 | ∆% | 1Q19 |
|---|---|---|---|
| Net interest income | 873 | 1.7 | 859 |
| Net fees and commissions | 469 | 13.4 | 413 |
| Net trading income | 61 | (44.0) | 108 |
| Other operating income and expenses | 103 | 10.1 | 94 |
| Of which insurance activities (1) | 119 | (8.3) | 130 |
| Gross income | 1,506 | 2.2 | 1,475 |
| Operating expenses | (778) | (4.4) | (814) |
| Personnel expenses | (440) | (6.8) | (472) |
| Other administrative expenses | (223) | 0.3 | (222) |
| Depreciation | (115) | (3.7) | (119) |
| Operating income | 728 | 10.3 | 661 |
| Impairment on financial assets not measured at fair value through profit or loss | (660) | n.s. | (55) |
| Provisions or reversal of provisions and other results | (265) | 115.4 | (123) |
| Profit/(loss) before tax | (196) | n.s. | 482 |
| Income tax | 57 | n.s. | (137) |
| Profit/(loss) for the year | (140) | n.s. | 346 |
| Non-controlling interests | (1) | 47,5 | (1) |
| Net attributable profit | (141) | n.s. | 345 |
- (1) Includes premiums received net of estimated technical insurance reserves.
| Balance sheets | 31-03-20 | ∆% | 31-12-19 |
|---|---|---|---|
| Cash, cash balances at central banks and other demand deposits | 20,057 | 26.1 | 15,903 |
| Financial assets designated at fair value | 155,484 | 26.6 | 122,844 |
| Of which: Loans and advances | 42,671 | 24.9 | 34,175 |
| Financial assets at amortized cost | 198,606 | 1.7 | 195,260 |
| Of which: Loans and advances to customers | 168,342 | 0.6 | 167,332 |
| Inter-area positions | 28,467 | 31.6 | 21,637 |
| Tangible assets | 3,219 | (2.5) | 3,302 |
| Other assets | 7,362 | 14.4 | 6,436 |
| Total assets/liabilities and equity | 413,193 | 13.1 | 365,380 |
| Financial liabilities held for trading and designated at fair value through profit or loss | 109,856 | 39.6 | 78,684 |
| Deposits from central banks and credit institutions | 55,280 | 34.5 | 41,092 |
| Deposits from customers | 186,327 | 2.2 | 182,370 |
| Debt certificates | 37,360 | 5.2 | 35,520 |
| Inter-area positions | - | - | - |
| Other liabilities | 14,687 | (20.5) | 18,484 |
| Economic capital allocated | 9,683 | 4.9 | 9,229 |
| Relevant business indicators | 31-03-20 | ∆% | 31-12-19 |
|---|---|---|---|
| Performing loans and advances to customers under management (1) | 165,786 | 1.0 | 164,140 |
| Non-performing loans | 8,413 | (2.6) | 8,635 |
| Customer deposits under management (1) | 186,327 | 2.2 | 182,370 |
| Off-balance sheet funds (2) | 58,528 | (11.4) | 66,068 |
| Risk-weighted assets | 110,929 | 5.7 | 104,911 |
| Efficiency ratio (%) | 51.6 | 57.5 | |
| NPL ratio (%) | 4.3 | 4.4 | |
| NPL coverage ratio (%) | 66 | 60 | |
| Cost of risk (%) | 1.54 | 0.08 |
- (1) Excluding repos.
- (2) Includes mutual funds, pension funds and other off-balance sheet funds.
Activity
The most relevant aspects related to the area's activity during the first quarter of 2020 were:
- The lending activity (performing loans under management) was 1.0% higher than at the end of 2019. The reduction in mortgage loans and credit cards was largely offset by higher balances in consumer (up 2.5%) and corporate banking (up 7.3%), where there was an increase in the availability of wholesale customer credit facilities toward the end of the quarter, triggered by the confinement decreed by the Government of Spain in mid-March 2020 as a result of the health crisis caused by COVID-19. The balances in the retail business and SMEs remained stable.
- In terms of asset quality, the non-performing loan ratio stood at 4.3% and the NPL coverage ratio at 66%.
- Total customer funds decreased by 1.4% from the end of 2019, resulting from two opposing trends: while customer deposits under management increased by 2.2%, off-balance sheet funds recorded a negative trend (down 11.4%) due to negative behavior of the markets.
Results
Spain generated a net attributable loss of €141m during the first quarter of 2020, compared to a profit of €345m in the same period the previous year, due to an increase in impairment on financial assets, as the operating income increased by 10.3% compared to the same period in 2019.
The main highlights of the area's income statement are:
- The net interest income increased from the first quarter of the previous year (up 1.7%), mainly due to the greater contribution of the ALCO portfolios.
- Net fees and commissions performed well (up 13.4% year-on-year), strongly supported by asset management commissions.
- NTI contribution was lower (down 44.0%) mainly due to lower ALCO portfolio contributions as well as irregular market performance during the first quarter as a result of the health crisis.
- • Other operating income and expenses recorded a growth of 10.1% with respect to the first quarter of 2019, due to lower costs associated with foreclosed properties.
- The downward trend in operating expenses (down 4.4% year-on-year) continued as a result of the cost reduction plans. As a result, the efficiency ratio stood at 51.6% compared to 55.2% registered during the same period in the previous year.
- The impairment on financial assets increased by €605m compared to the first quarter of 2019, mainly due to the negative impact of €517m from the deterioration of the macro scenario caused by COVID-19, which includes loan-loss provisions for the most affected sectors. The comparison is also affected by the portfolio sales last year.
- Finally, provisions and other results closed at €-265m, or 115.4% above the previous year, where the provisions derived from the rates applied in the so-called revolving credit cards are noteworthy.