
The United States
Highlights
- Activity driven by the dynamic performance of the commercial portfolio and corporate banking in the quarter.
- Net interest income affected by the Fed’s rate cuts.
- Good performance of fees and commissions and excellent NTI results.
- Net attributable profit affected by the significant increase in the impairment on financial assets line.
Business activity (1)
(Year-on-year change at constant exchange rate. Data as of 31-03-20)
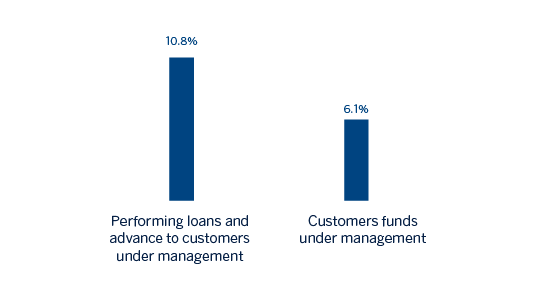
(1) Excluding repos.
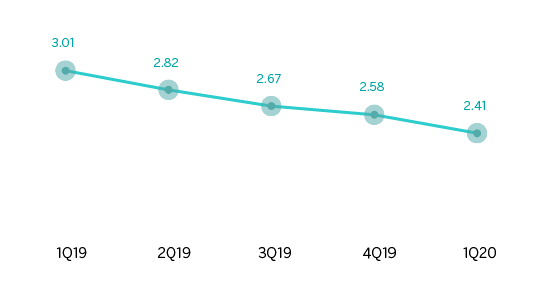
Net interest income/ATAs
(Percentage. Constant exchange rate)
Operating income
(Millions of euros at constant exchange rate)

(1) At current exchange rate: -4.8%.
Net attributable profit
(Millions of euros at constant exchange rate)
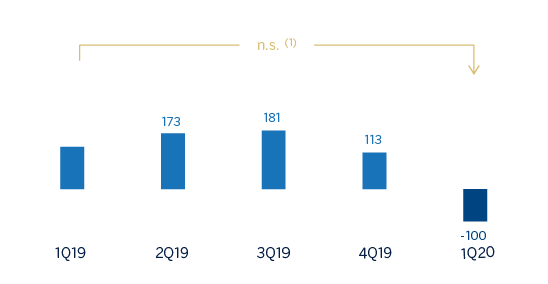
(1) At current exchange rate: n.s.
Financial statements and relevant business indicators
(Millions of euros and percentage)
| Income statement | 1Q20 | ∆% | ∆% (1) | 1Q19 |
|---|---|---|---|---|
| Net interest income | 549 | (10.7) | (13.3) | 615 |
| Net fees and commissions | 176 | 16.9 | 13.5 | 151 |
| Net trading income | 93 | 128.4 | 122.0 | 41 |
| Other operating income and expenses | (4) | 51.4 | 46.5 | (3) |
| Gross income | 814 | 1.3 | (1.7) | 804 |
| Operating expenses | (499) | 5.5 | 2.4 | (473) |
| Personnel expenses | (299) | 7.8 | 4.6 | (278) |
| Other administrative expenses | (147) | 5.2 | 2.2 | (140) |
| Depreciation | (53) | (5.1) | (7.9) | (55) |
| Operating income | 315 | (4.8) | (7.6) | 331 |
| Impaiment on financial assets not measured at fair value through profit or loss | (426) | 163.9 | 156.2 | (162) |
| Provisions or reversal of provisions and other results | (1) | (91.4) | (91.6) | (10) |
| Profit/(loss) before tax | (112) | n.s. | n.s. | 160 |
| Income tax | 12 | n.s. | n.s. | (32) |
| Profit/(loss) for the year | (100) | n.s. | n.s. | 127 |
| Non-controlling interests | - | n.s. | n.s. | - |
| Net attributable profit | (100) | n.s. | n.s. | 127 |
| Balance sheets | 31-03-20 | ∆% | ∆%(1) | 31-12-19 |
|---|---|---|---|---|
| Cash, cash balances at central banks and other demand deposits | 10,668 | 28.6 | 25.5 | 8,293 |
| Financial assets designated at fair value | 7,674 | 0.2 | (2.3) | 7,659 |
| Of which: Loans and advances | 346 | 32.5 | 29.2 | 261 |
| Financial assets at amortized cost | 77,134 | 11.0 | 8.2 | 69,510 |
| Of which: Loans and advances to customers | 69.619 | 10.2 | 7.5 | 63.162 |
| Inter-area positions | - | - | - | - |
| Tangible assets | 933 | 2.1 | (0.4) | 914 |
| Other assets | 2,668 | 23.9 | 20.9 | 2,153 |
| Total assets/liabilities and equity | 99,077 | 11.9 | 9.1 | 88,529 |
| Financial liabilities held for trading and designated at fair value through profit or loss | 633 | 124.9 | 119.3 | 282 |
| Deposits from central banks and credit institutions | 4,405 | 7.9 | 5.3 | 4,081 |
| Deposits from customers | 70,917 | 5.0 | 2.4 | 67,525 |
| Debt certificates | 3,458 | (2.6) | (5.0) | 3,551 |
| Inter-area positions | 9,398 | 175.1 | 168.3 | 3,416 |
| Other liabilities | 6,397 | 9.7 | 7.0 | 5,831 |
| Economic capital allocated | 3,869 | 0.7 | (1.8) | 3,843 |
| Relevant business indicators | 31-03-20 | ∆% | ∆% (1) | 31-03-19 |
|---|---|---|---|---|
| Performing loans and advances to customers under management (2) | 70,117 | 10.9 | 8.1 | 63,241 |
| Non-performing loans | 740 | 1.4 | (1.1) | 730 |
| Customer deposits under management (2) | 70,914 | 5.0 | 2.4 | 67.528 |
| Off-balance sheet funds (3) | - | - | - | - |
| Risk-weighted assets | 68,765 | 5.5 | 2.9 | 65,170 |
| Efficiency ratio (%) | 61.3 | 61.0 | ||
| NPL ratio (%) | 1.0 | 1.1 | ||
| NPL coverage ratio (%) | 142 | 101 | ||
| Cost of risk (%) | 2.60 | 0.88 |
- (1) Figures at constant exchange rate.
- (2) Excluding repos.
- (3) No incluye las cesiones temporales de activos.
- (4) Includes mutual funds, pension funds and other off-balance sheet funds.
Activity
Unless expressly stated otherwise, all the comments below on rates of change, for both activity and earnings, will be given at constant exchange rates. These rates, together with the changes at the current exchange rates, can be found in the attached tables of financial statements and relevant business indicators.
The most relevant aspects related to the area's activity during the first quarter of 2020 were:
- The Lending activity for the area (performing loans under management) increased both in the quarter and over the same period in the previous year (up 8.1% and up 10.8%, respectively), mainly due to the dynamism of the commercial portfolio and corporate banking, where an increase in the drawing down of credit facilities has been observed toward the end of the first quarter. The rest of the retail portfolio remained virtually unchanged over the quarter (down 0.3%), with increases in the consumer and credit card portfolios.
- In terms of the risk indicators, the NPL ratio remained virtually unchanged over the quarter and closed at 1.0% as of March 31, 2020. The NPL coverage ratio improved to 142%.
- Customer deposits under management increased by 2.4% in the quarter, explained by an increase in demand deposits (up 5.5%), which offset the decrease in time deposits (down 9.0%).
Results
The United States generated a net attributable loss of €100m during the first quarter of 2020, compared to the profit of €127m in the same period of the previous year. The most relevant aspects related to the income statement are summarized below:
- Net interest income fell by 13.3% year-on-year, impacted by interest rate cuts, for a total of 225 basis points, made by the Fed since the first quarter 2019.
- Net fees and commissions closed with an increase of 13.5% compared to the same period in the previous year, due mainly to the increase in those relating to investment banking and retail establishments.
- NTI contribution increased (up 122.0% year-on-year) as a result of higher capital gains from the sale of ALCO portfolios.
- Operating expenses increased (up 2.4% year-on-year), mainly due to the growth in personnel expenses.
- Increase in the impairment on financial assets (up 156.2% year-on-year), fundamentally related to the adjustment in the macro scenario due to the negative effects of COVID-19 and, to a lesser extent, to higher loan-loss provisions to cover specific clients from the Oil & Gas sector, for an aggregated amount of €280m. Consequently, the cumulative cost of risk as of March 2020 increased to 2.60%, compared to 1.06 % as of March 2019.
- Finally, the heading of provisions and other results closed at €-1m, including provisions as a consequence of COVID-19 amounting to €23m.