
Mexico
Highlights
- Good performance of lending activity, supported by the strength of the wholesale portfolio.
- Positive evolution of customer funds, both demand and time deposits.
- Strong operating income.
- Net attributable profit affected by the significant increase in the impairment on financial assets line.
Business activity (1)
(Year-on-year change at constant exchange rate. Data as of 31-03-20)
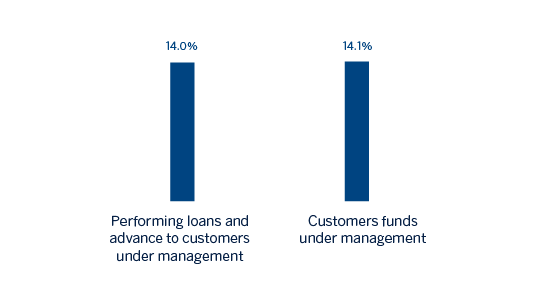
(1) Excluding repos.
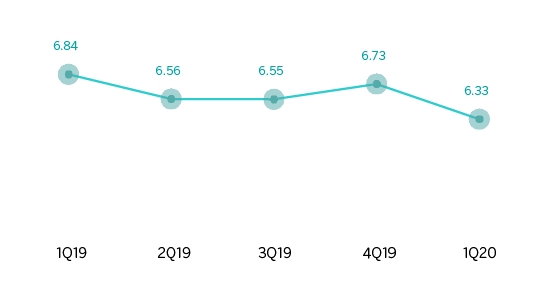
Net interest income/ATAs
(Percentage. Constant exchange rate)
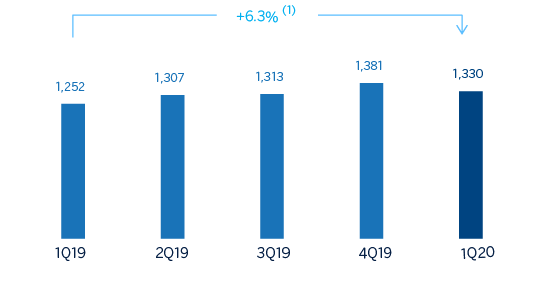
Operating income
(Millions of euros at constant exchange rate)
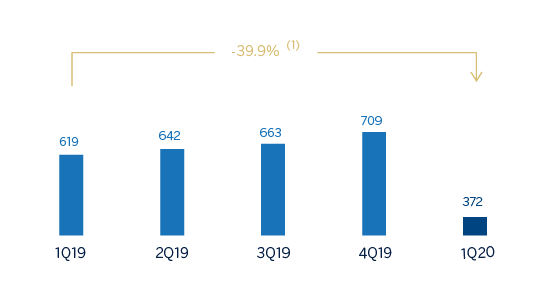
Net attributable profit
(Millions of euros at constant exchange rate)
(1) At current exchange rate: +4.9%.
(1) At current exchange rate: -40.6%.
Financial statements and relevant business indicators (Millions of euros and percentage)
| Income statement | 1Q20 | ∆% | ∆% (1) | 1Q19 |
|---|---|---|---|---|
| Net interest income | 1,545 | 3.0 | 4.4 | 1,500 |
| Net fees and commissions | 296 | (1.4) | (0.1) | 300 |
| Net trading income | 78 | 25.1 | 26.7 | 63 |
| Other operating income and expenses | 71 | 78.5 | 80.8 | 40 |
| Gross income | 1,991 | 4.6 | 6.0 | 1,902 |
| Operating expenses | (660) | 4.1 | 5.5 | (634) |
| Personnel expenses | (286) | 6.3 | 7.7 | (269) |
| Other administrative expenses | (289) | 2.7 | 4.1 | (281) |
| Depreciation | (86) | 1.8 | 3.1 | (84) |
| Operating income | 1,330 | 4.9 | 6.3 | 1,268 |
| Impairment on financial assets not measured at fair value through profit or loss | (773) | 95.9 | 98.5 | (395) |
| Provisions or reversal of provisions and other results | (13) | n.s. | n.s. | 4 |
| Profit/(loss) before tax | 545 | (37.9) | (37.1) | 877 |
| Income tax | (172) | (31.1) | (30.2) | (250) |
| Profit/(loss) for the year | 372 | (40.6) | (39.9) | 627 |
| Non-controlling interests | - | - | - | - |
| Net attributable profit | 372 | (40.6) | (39.9) | 627 |
| Balance sheets | 31-03-20 | ∆% | ∆% (1) | 31-12-19 |
|---|---|---|---|---|
| Cash, cash balances at central banks and other demand deposits | 5.848 | (9,9) | 11,2 | 6.489 |
| Financial assets designated at fair value | 34.750 | 10,7 | 36,5 | 31.402 |
| Of which loans and advances | 990 | 27,4 | 57,2 | 777 |
| Financial assets at amortized cost | 58.839 | (11,1) | 9,7 | 66.180 |
| Of which loans and advances to customers | 50.484 | (13,1) | 7,2 | 58.081 |
| Tangible assets | 1.598 | (21,0) | (2,5) | 2.022 |
| Other assets | 3.166 | 6,0 | 30,8 | 2.985 |
| Total assets/liabilities and equity | 104.201 | (4,5) | 17,8 | 109.079 |
| Financial liabilities held for trading and designated at fair value through profit or loss | 25.598 | 17,5 | 45,0 | 21.784 |
| Deposits from central banks and credit institutions | 3.270 | 54,4 | 90,5 | 2.117 |
| Deposits from customers | 49.072 | (12,3) | 8,2 | 55.934 |
| Debt certificates | 8.879 | 0,4 | 23,9 | 8.840 |
| Other liabilities | 11.831 | (23,7) | (5,9) | 15.514 |
| Economic capital allocated | 5.551 | 13,5 | 40,1 | 4.889 |
| Relevant business indicators | 31-03-20 | ∆% | ∆% (1) | 31-12-19 |
|---|---|---|---|---|
| Performing loans and advances to customers under management (2) | 51,172 | (12.7) | 7.7 | 58,617 |
| Non-performing loans | 1,251 | (15.4) | 4.4 | 1,478 |
| Customer deposits under management (2) | 48,937 | (11.6) | 9.1 | 55,331 |
| Off-balance sheet funds (3) | 20,617 | (15.7) | 4.0 | 24,464 |
| Risk-weighted assets | 53,522 | (9.7) | 11.3 | 59,299 |
| Efficiency ratio (%) | 33.2 | 32.9 | ||
| NPL ratio (%) | 2.3 | 2.4 | ||
| NPL coverage ratio (%) | 155 | 136 | ||
| Cost of risk (%) | 5.30 | 3.01 |
(1) Figures at constant exchange rate.
(2) Excluding repos.
(3) Includes mutual funds, pension funds and other off-balance sheet funds.
Activity
Unless expressly stated otherwise, all the comments below on rates of change, for both activity and earnings, will be given at constant exchange rates. These rates, together with changes at current exchange rates, can be found in the attached tables of financial statements and relevant business indicators.
The most important developments in relation to activity in the area during the first three months of 2020 have been:
- Lending activity (performing loans under management) grew 7.7% in the quarter, supported by the performance of the wholesale portfolio and without any significant impacts from COVID-19 having yet materialized.
- The wholesale portfolio increased 15.2%, mainly driven by the depreciation of the Mexican peso against the US dollar, which especially benefited the corporate portfolio due to its higher percentage of US dollar-denominated loans and therefore increased by 16.9% in the quarter. The retail portfolio remained flat during the first three months of 2020 (up 0.2%), thanks to the stability in consumer loans (payroll and auto loans, mainly) and mortgages that grew 1.0% and 1.3%, respectively, compared to December 2019.
- The asset quality indicators improved compared to December 2019. As a result, the NPL ratio stood at 2.3% and the coverage ratio at 155%.
- Total customer funds (customer deposits under management, mutual funds and other off-balance sheet funds) grew by 7.5% in the quarter. The increase is explained by a rise in both demand deposits and time deposits (up 9.1%), partly benefiting from the depreciation of the Mexican peso, as well as the positive trend in mutual funds (up 4.3%).
Results
BBVA Mexico achieved a net attributable profit of €372m in the first quarter of 2020, which is a 39.9% reduction compared to the same quarter in the previous year. This was due to an increase in the impairment on financial assets, as the area’s operating income grew by 6.3% compared to the same quarter in 2019. The most relevant aspects related to the income statement are summarized below:
- Net interest income grew by 4.4% year-on-year, mainly due to the increase in volumes in both the wholesale and retail portfolios.
- Net fees and commissions remained flat (down 0.1%), as a result of the bank's ongoing review and reduction of fees for the benefit of customers.
- NTI performed strongly, with a year-on-year growth of 26.7%. This was mainly a result of the performance of the BBVA Seguros portfolio in Mexico.
- The other operating income and expenses line registered a year-on-year increase of 80.8%, helped by the good performance of the insurance business.
- The impairment on financial assets line increased by 98.5%, mainly due to the extraordinary deterioration in the macro scenario resulting from the impact of COVID-19, which amounted to €320m. As a result, the cost of risk stood at 5.30%.
- In the provisions and other results line, the comparison was negative due to higher provisions for contingencies.