
South America
Highlights
- Growth in lending, driven by the wholesale portfolio.
- Year-on-year increase of net interest income.
- Lower contribution from NTI.
- Net attributable profit affected by the increase in the impairment on financial assets line.
Business activity (1)
(Year-on-year change at constant exchange rates. Data as of 31-03-20)
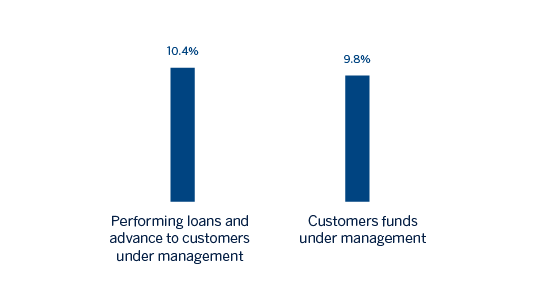
(1) Excluding repos.
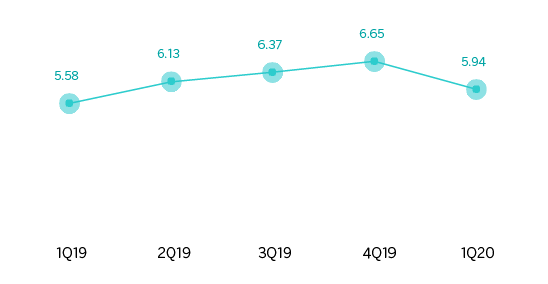
Net interest income/ATAs
(Percentage. Constant exchange rates)
Operating income
(Millions of euros at constant exchange rates)
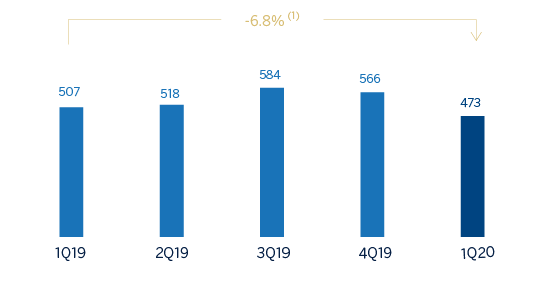
(1) At current exchange rate: -22.0%.
Net attributable profit
(Millions of euros at constant exchange rates)
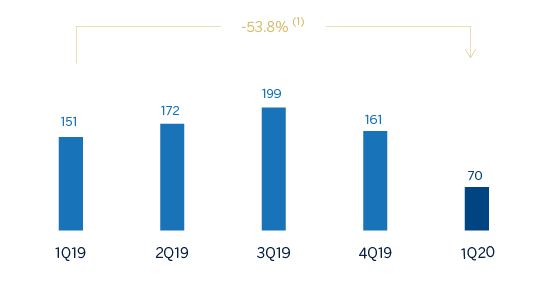
(1) At current exchange rate: -63.8%
Financial statements and relevant business indicators (Millions of euros and percentage)
| Income statement | 1Q20 | ∆% | ∆% (1) | 1Q19 |
|---|---|---|---|---|
| Net interest income | 763 | 0.4 | 14.6 | 760 |
| Net fees and commissions | 119 | (11.5) | (1.9) | 135 |
| Net trading income | 80 | (61.0) | (50.7) | 206 |
| Other operating income and expenses | (100) | (13.8) | (7.7) | (116) |
| Gross income | 863 | (12.4) | 2.4 | 985 |
| Operating expenses | (390) | 2.9 | 16.4 | (379) |
| Personnel expenses | (197) | 1.2 | 15.8 | (195) |
| Other administrative expenses | (148) | 4.2 | 17.5 | (142) |
| Depreciation | (44) | 6.6 | 15.6 | (41) |
| Operating income | 473 | (22.0) | (6.8) | 606 |
| Impaiment on financial assets not measured at fair value through profit or loss | (319) | 80.1 | 97.5 | (177) |
| Provisions or reversal of provisions and other results | (18) | 42.3 | 67.8 | (12) |
| Profit/(loss) before tax | 137 | (67.2) | (59.3) | 417 |
| Income tax | (29) | (78.7) | (74.4) | (138) |
| Profit/(loss) for the year | 107 | (61.6) | (51.4) | 279 |
| Non-controlling interests | (37) | (56.6) | (46.4) | (86) |
| Net attributable profit | 70 | (63.8) | (53.8) | 193 |
| Balance sheets | 31-03-20 | ∆% | ∆% (1) | 31-12-19 |
|---|---|---|---|---|
| Cash, cash balances at central banks and other demand deposits | 8,313 | (3.3) | 2.4 | 8,601 |
| Financial assets designated at fair value | 7,561 | 23.5 | 36.5 | 6,120 |
| Of which loans and advances | 263 | 130.8 | 179.1 | 114 |
| Financial assets at amortized cost | 36,146 | (4.5) | 3.7 | 37,869 |
| Of which loans and advances to customers | 34,202 | (4.2) | 4.2 | 35,701 |
| Tangible assets | 921 | (4.9) | (1.1) | 968 |
| Other assets | 1,830 | 27.2 | 36.7 | 1,438 |
| Total assets/liabilities and equity | 54,772 | (0.4) | 7.8 | 54,996 |
| Financial liabilities held for trading and designated at fair value through profit or loss | 2,006 | 7.8 | 28.1 | 1,860 |
| Deposits from central banks and credit institutions | 4,055 | 10.9 | 16.9 | 3,656 |
| Deposits from customers | 35,949 | (0.4) | 8.1 | 36,104 |
| Debt certificates | 3,105 | (3.6) | 3.1 | 3,220 |
| Other liabilities | 7,143 | (6.8) | (1.1) | 7,664 |
| Economic capital allocated | 2,514 | 0.9 | 10.9 | 2,492 |
| Relevant business indicators | 31-03-20 | ∆% | ∆% (1) | 31-12-19 |
|---|---|---|---|---|
| Performing loans and advances to customers under management (2) | 34,153 | (4.1) | 4.3 | 35,598 |
| Non-performing loans | 1,803 | (2.7) | 6.3 | 1,853 |
| Customer deposits under management (3) | 35,964 | (0.4) | 8.1 | 36,123 |
| Off-balance sheet funds (4) | 12,935 | 0.6 | 1.0 | 12,864 |
| Risk-weighted assets | 44,876 | (1.2) | 6.5 | 45,413 |
| Efficiency ratio (%) | 45.2 | 40.9 | ||
| NPL ratio (%) | 4.4 | 4.4 | ||
| NPL coverage ratio (%) | 104 | 100 | ||
| Cost of risk (%) | 3.00 | 1.88 |
- (1) Figures at constant exchange rates.
- (2) Excluding repos.
- (3) Excluding repos and including specific marketable debt securities.
- (4) Includes mutual funds, pension funds and other off-balance sheet funds.
South America. Data per country (Millions of euros)
| Operating income | Net attributable profit | |||||||
|---|---|---|---|---|---|---|---|---|
| Country | 1Q20 | ∆% | ∆% (1) | 1Q19 | 1Q20 | ∆% | ∆% (1) | 1Q19 |
| Argentina | 92 | (47.1) | (4.8) | 174 | 8 | (87.0) | (70.4) | 60 |
| Colombia | 140 | (17.3) | (9.4) | 169 | 8 | (85.8) | (84.5) | 58 |
| Peru | 183 | (5.2) | (5.8) | 194 | 30 | (30.3) | (30.7) | 43 |
| Other countries (2) | 58 | (17.2) | (6.2) | 70 | 24 | (26.1) | (15.8) | 32 |
| Total | 473 | (22.0) | (6.8) | 606 | 70 | (63.8) | (53.8) | 193 |
- (1) Figures at constant exchange rates.
- (2) Bolivia, Chile (Forum), Paraguay, Uruguay and Venezuela. Additionally, it includes eliminations and other charges.
South America. Relevant business indicators per country (Millions of euros)
| Argentina | Colombia | Peru | ||||
|---|---|---|---|---|---|---|
| 31-03-20 | 31-12-19 | 31-03-20 | 31-12-19 | 31-03-20 | 31-12-19 | |
| Performing loans and advances to customers under management (1) (2) | 3,143 | 2,791 | 11,094 | 10,625 | 15,470 | 14,902 |
| Non-performing loans and guarantees given (1) | 114 | 100 | 628 | 613 | 866 | 800 |
| Customer deposits under management (1) (3) | 4,638 | 4,159 | 12,015 | 10,495 | 14,765 | 14,518 |
| Off-balance sheet funds (1) (4) | 946 | 614 | 689 | 1,148 | 1,861 | 1,805 |
| Risk-weighted assets | 6,910 | 6,093 | 13,100 | 14,172 | 19,278 | 19,293 |
| Efficiency ratio (%) | 56.2 | 46.9 | 39.3 | 36.2 | 39.5 | 35.8 |
| NPL ratio (%) | 3.5 | 3.4 | 5.2 | 5.3 | 4.3 | 4.1 |
| NPL coverage ratio (%) | 148 | 161 | 107 | 98 | 100 | 96 |
| Cost of risk (%) | 2.62 | 4.22 | 4.01 | 1.67 | 2.43 | 1.45 |
- (1) Figures at constant exchange rates.
- (2) Excluding repos.
- (3) Excluding repos and including specific marketable debt securities.
- (4) Includes mutual funds and other off-balance sheet funds.
Activity and results
Unless expressly stated otherwise, all the comments below on rates of change, for both activity and results, will be given at constant exchange rates. These rates, together with the changes at current exchange rates, can be found in the attached tables of financial statements and relevant business indicators.
The most relevant aspects related to the area's activity in the first quarter of 2020 were:
- Lending activity (performing loans under management) was higher than at the end of 2019, up 4.3%. The performance of the wholesale portfolio is noteworthy, due to greater drawdowns of credit facilities by companies in response to the situation generated by the COVID-19 health crisis. With regard to asset quality, the NPL ratio remained at 4.4%, the same level seen at the end of 2019, and the NPL coverage ratio has increased to 104%.
- On the funding side, customer deposits under management increased by 8.1% in the year, mainly due to the growth of demand deposits and, to a lesser extent, time deposits. Off-balance sheet funds grew by 1.0% in the same period.
Regarding results, South America generated a cumulative net attributable profit of €70m between January and March 2020, representing a year-on-year change of -53.8% (down 63.8% at current exchange rates), mainly due to the increase in the impairment on financial assets caused by the COVID-19 crisis. The cumulative impact of inflation in Argentina on the area’s net attributable profit in the first quarter of 2020 amounted to €-34m, compared to €-49m in the first quarter of 2019.
The most notable aspects of the evolution of the income statement in the first quarter are summarized below:
- Net interest income increased by 14.6% (up 0.4% at current exchange rates).
- Reduced contribution from NTI (down 50.7% at constant exchange rates, down 61.0% at current exchange rates) due to the effect of the generalized fall in the markets which affected the valuation of the portfolio, and a smaller contribution from foreign currency transactions.
- Increase in operating expenses below the inflation rate of the region (up 16.4%, up 2.9% at current exchange rates), mainly due to the impact of inflation in Argentina.
- Increased need for impairment on financial assets (up 97.5%, up 80.1% at current exchange rates) mainly due to the extraordinary deterioration in the macroeconomic scenario caused by the impact of COVID-19 for €145m, causing the cost of risk to increase to 3.00% at the end of March 2020.
The most significant countries in the business area, Argentina, Colombia and Peru, performed as follows in the first quarter of 2020 in terms of activity and results:
Argentina
- Lending activity grew by 12.6% in the quarter due to the increase in wholesale portfolios. With regard to asset quality, the NPL ratio increased and stood at 3.5% as of March 31, 2020, continuing to perform better than the system according to the latest data available.
- In terms of funding, the customer deposits under management increased by 11.5%, with growth in both time and demand deposits, while off-balance sheet funds increased by 54.1%, both compared to December 2019 figures.
- Net attributable profit stood at €8m, or 70.4% below the previous year’s figure. The good performance in the generation of net interest income and fees and commissions was negatively impacted by higher operating expenses, strongly influenced by the high levels of inflation, and by the greater need for the impairment on financial assets resulting from the COVID-19 crisis (€39m).
Colombia
- Lending activity increased by 4.4% in the quarter due to the performance of the wholesale portfolios. In terms of asset quality, the NPL ratio improved and fell to 5.2% at the end of March 2020.
- Customer deposits under management increased by 14.5%, driven by the growth in demand and time deposits. In contrast, off-balance sheet funds declined due to withdrawals in mutual funds at the end of the quarter.
- The net attributable profit stood at €8m, with a year-on-year fall of 84.5%. The generation of recurring income remains stable regarding the net interest income, but the COVID-19 crisis has had a negative impact on both the generation of NTI, and especially on loan-loss provisions for an amount of €64m.
Peru
- Lending activity was 3.8% higher than at the end of 2019, mainly due to the wholesale portfolio. With regard to asset quality, the NPL ratio increased to 4.3% and the NPL coverage ratio reached 100%.
- Customer deposits under management increased by 1.7% in the quarter, mainly due to the 3.5% growth in demand deposits. Off-balance sheet funds increased by 3.1%.
- Net interest income remained stable with respect to 2019 because the pressure on interest rates offset the effect of the higher volume of activity. Of great significance is the increase in the impairment on financial assets as a result of increased loan-loss provisions due to the COVID-19 crisis, which amounted to €42m, as well as a provision of €1m in provisions and other results, and resulted in a 30.7% decrease in net attributable profit to €30m.