
Turkey
Highlights
- Activity has performed well, in both Turkish lira and US dollars.
- Positive evolution of customer funds, especially from demand deposits.
- Good NTI performance and operating expenses growing below inflation.
- Net attributable profit affected by the significant increase in the impairment on financial assets line.
Business activity (1)
(Year-on-year change at constant exchange rate. Data as of 31-03-20)
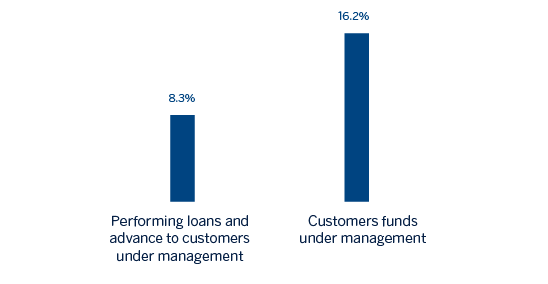
(1) Excluding repos.
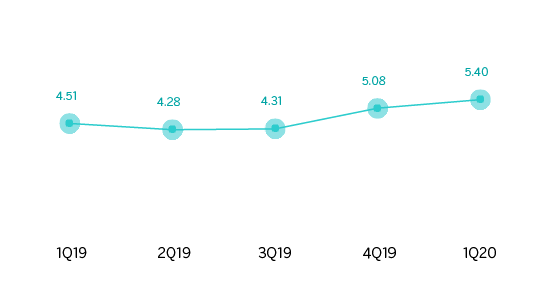
Net interest income/ATAs
(Percentage. Constant exchange rate)
Operating income
(Millions of euros at constant exchange rate)
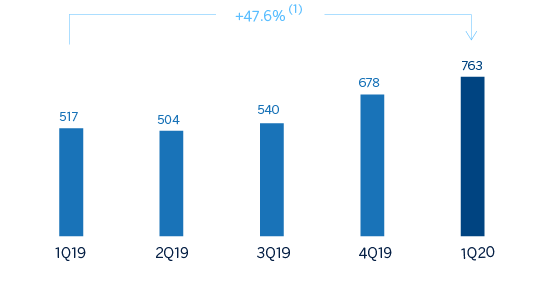
(1) At current exchange rate: +33.7%.
Net attributable profit
(Millions of euros at constant exchange rate)
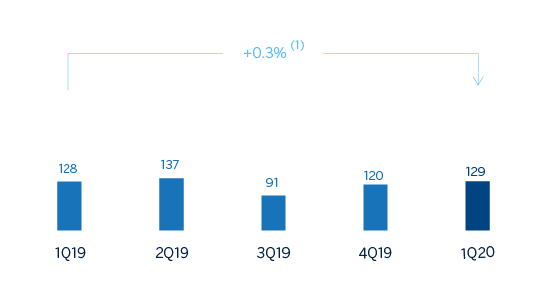
(1) At current exchange rate: -9.1%
Financial statements and relevant business indicators (Millions of euros and percentage)
| Income statement | 1Q20 | ∆% | ∆% (1) | 1Q19 |
|---|---|---|---|---|
| Net interest income | 819 | 18.0 | 30.2 | 695 |
| Net fees and commissions | 165 | (14.9) | (6.1) | 194 |
| Net trading income | 67 | n.s. | n.s. | (11) |
| Other operating income and expenses | 22 | 273.6 | n.s. | 6 |
| Gross income | 1,073 | 21.5 | 34.0 | 884 |
| Operating expenses | (310) | (0.9) | 9.3 | (313) |
| Personnel expenses | (157) | (8.5) | 0.9 | (171) |
| Other administrative expenses | (105) | 8.2 | 19.4 | (97) |
| Depreciation | (48) | 8.4 | 19.6 | (44) |
| Operating income | 763 | 33.7 | 47.6 | 571 |
| Impairment on financial assets not measured at fair value through profit or loss | (403) | 100.1 | 120.8 | (202) |
| Provisions or reversal of provisions and other results | (20) | n.s. | n.s. | (1) |
| Profit/(loss) before tax | 340 | (7.6) | 1.9 | 368 |
| Income tax | (78) | (1.4) | 8.8 | (79) |
| Profit/(loss) for the year | 262 | (9.3) | 0.0 | 289 |
| Non-controlling interests | (133) | (9.6) | (0.2) | (147) |
| Net attributable profit | 129 | (9.1) | 0.3 | 142 |
| Balance sheets | 31-03-20 | ∆% | ∆% (1) | 31-12-19 |
|---|---|---|---|---|
| Cash, cash balances at central banks and other demand deposits | 5,194 | (5.3) | 2.1 | 5,486 |
| Financial assets designated at fair value | 5,059 | (4.0) | 3.5 | 5,268 |
| Of which loans and advances | 463 | 4.2 | 12.4 | 444 |
| Financial assets at amortized cost | 50,863 | (0.8) | 6.9 | 51,285 |
| Of which loans and advances to customers | 39,916 | (1.4) | 6.3 | 40,500 |
| Tangible assets | 1,033 | (7.5) | (0.3) | 1,117 |
| Other assets | 1,355 | 7.6 | 16.0 | 1,260 |
| Total assets/liabilities and equity | 63,504 | (1.4) | 6.3 | 64,416 |
| Financial liabilities held for trading and designated at fair value through profit or loss | 2,336 | 7.0 | 15.3 | 2,184 |
| Deposits from central banks and credit institutions | 4,415 | (1.3) | 6.4 | 4,473 |
| Deposits from customers | 41,058 | (0.7) | 7.1 | 41,335 |
| Debt certificates | 4,201 | (1.6) | 6.0 | 4,271 |
| Other liabilities | 8,704 | (8.2) | (1.0) | 9,481 |
| Economic capital allocated | 2,790 | 4.4 | 12.5 | 2,672 |
| Relevant business indicators | 31-03-20 | ∆% | ∆% (1) | 31-12-19 |
|---|---|---|---|---|
| Performing loans and advances to customers under management (2) | 39,473 | (0.5) | 7.3 | 39,662 |
| Non-performing loans | 3,503 | (4.4) | 3.1 | 3,663 |
| Customer deposits under management (2) | 41,050 | (0.7) | 7.1 | 41,324 |
| Off-balance sheet funds (3) | 3,863 | (1.1) | 6.6 | 3,906 |
| Risk-weighted assets | 59,163 | 4.5 | 12.6 | 56,642 |
| Efficiency ratio (%) | 28.9 | 33.8 | ||
| NPL ratio (%) | 6.7 | 7.0 | ||
| NPL coverage ratio (%) | 86 | 75 | ||
| Cost of risk (%) | 3.80 | 2.07 |
(1) Figures at constant exchange rate.
(2) Excluding repos.
(3) Includes mutual funds, pension funds and other off-balance sheet funds.
Activity
Unless expressly stated and communicated otherwise, rates of changes explained ahead, both for activity and for income, will be presented at constant exchange rates. These rates, together with changes at current exchange rates, can be observed in the attached tables of the financial statements and relevant business indicators.
The most relevant aspects related to the area’s activity during the first quarter of 2020 were:
- Lending activity (performing loans under management) increased by 7.3% year-to-date mainly driven by a growth in Turkish lira loans (up 4.7%) which was supported by a lower interest rate environment and pent up demand from both commercial and retail customers after the contraction in 2019. Foreign-currency loans (in US dollars) also showed a positive trend during the first quarter 2020 and increased by 2.2%.
- By segments, Turkish-lira commercial loans continued to grow in the quarter thanks to declining interest rates, although a reduction in activity was noted by the end of the quarter. In addition, consumer loans increased significantly, mainly driven by the increase in General Purpose Loans.
- In terms of asset quality, the NPL ratio improved to 6.7% from 7.0% as of December 31, 2019 due to less NPL entries in the quarter supported by the good performance of the recoveries. The NPL coverage ratio stood at 86% as of March 31, 2020.
- Customer deposits (65% of total liabilities in the area as of March 31, 2020) remained the main source of funding for the balance sheet and increased by 7.1% in the quarter. It is worth mentioning the good performance of demand deposits, whose share in total customer deposits is 42.1%, which increased by 18.3% as of March 2020.
Results
Turkey generated a net attributable profit of €129m in the first quarter of 2020, in line with the one generated in the same period of the previous year, despite the impact of the increase in the impairment losses on financial assets, rising the operating income by 47.6%. The most significant aspects of the year-on-year evolution in the income statement are the following:
- Net interest income grew (up 30.2%) mainly due to higher Turkish lira customer spreads as well as to higher loan volumes and which was partially offset by a lower contribution from inflation-linked bonds.
- Changes in the regulation that limit certain commissions banks can charge customers, which entered into force in March 2020, are the main drivers for the decrease in net fees and commissions of 6.1% in the quarter.
- NTI closed the quarter with a positive result comparing favorably with the losses of the first quarter of 2019. This is mainly due to the positive impact of foreign-exchange rates, the good performance of hedging and foreign currency trading operations and the results generated by trading operations.
- Other operating income and expenses increased significantly compared to the same period in 2019 mainly due to the positive evolution of non-financial services and net insurance earnings, and stood at €22m at the end of March 2020.
- Operating expenses increased by 9.3%, significantly below the average inflation rate. As a result of a strict cost-control discipline, the efficiency ratio remained at low levels (28.9%).
- Impairment losses on financial assets strongly increased by 120.8% because of provisions for specific commercial portfolio customers and, specially, the adjustment in the macro scenario due to the negative effects of COVID-19. This increase amounted to €169m. As a result, the cost of risk increased to 3.80%.