Mexico highlights in the third quarter
- Strong performance of the retail portfolio, especially consumer and SME.
- Double-digit growth of retail customer demand deposits.
- Positive performance of the insurance business.
- Sustained recurring revenue.
- Successful issuance of capital notes on international markets.
Industry Trends
Mexico’s financial system remains stable and sound. This is reflected in its adequate liquidity position, and its high solvency, which is far above the regulatory minimum.
Commercial bank lending to the private sector continues to expand steadily. At the close of August it registered the 19th successive month of double-digit growth rates. The best performing portfolios are consumer finance (payroll accounts and personal loans) and corporate lending.
In customer deposits, the retail segment also performed well, while time deposits grew at a slower pace as they were replaced by investment companies (SIDs).
Both the fixing and average peso/euro exchange rates appreciated over the quarter and the last 12 months. This has had a positive impact on the balance sheet and activity for the last 12 months and the quarter, and to a lesser extent on the Group’s income statement. Unless otherwise indicated, all comments below on percentage changes refer to constant exchange rates, with the aim of providing a better understanding of the performance of the business in Mexico.
Income statement
(Million euros)
|
|
Units: |
|
Mexico |
Banking Business |
Pensions and Insurance |
|
Jan.-Sep. 12 |
Δ% |
Δ% (1) |
Jan.-Sep. 11 |
Jan.-Sep. 12 |
Δ% |
Δ% (1) |
Jan.-Sep. 11 |
Jan.-Sep. 12 |
Δ% |
Δ% (1) |
Jan.-Sep. 11 |
| Net interest income |
3,079 |
8.4 |
8.5 |
2,840 |
3,021 |
8.6 |
8.7 |
2,780 |
56 |
3.2 |
3.3 |
54 |
| Net fees and commissions |
938 |
3.6 |
3.7 |
906 |
886 |
4.6 |
4.7 |
847 |
52 |
(2.3) |
(2.2) |
53 |
| Net trading income |
188 |
(28.6) |
(28.5) |
264 |
136 |
(33.0) |
(33.0) |
204 |
51 |
(15.2) |
(15.2) |
60 |
| Other income/expenses |
212 |
29.1 |
29.2 |
164 |
(93) |
9.4 |
9.5 |
(85) |
345 |
16.5 |
16.6 |
296 |
| Gross income |
4,418 |
5.8 |
5.9 |
4,174 |
3,950 |
5.4 |
5.5 |
3,746 |
503 |
8.7 |
8.8 |
463 |
| Operating costs |
(1,668) |
9.8 |
9.9 |
(1,519) |
(1,584) |
10.9 |
11.0 |
(1,428) |
(115) |
(4.5) |
(4.4) |
(121) |
| Personnel expenses |
(715) |
7.8 |
7.9 |
(663) |
(661) |
8.8 |
8.9 |
(607) |
(54) |
(3.6) |
(3.5) |
(56) |
| General and administrative expenses |
(856) |
10.1 |
10.2 |
(778) |
(828) |
11.2 |
11.3 |
(744) |
(60) |
(4.4) |
(4.3) |
(63) |
| Deprecation and amortization |
(97) |
23.8 |
23.9 |
(78) |
(96) |
25.3 |
25.4 |
(76) |
(1) |
(32.2) |
(32.1) |
(2) |
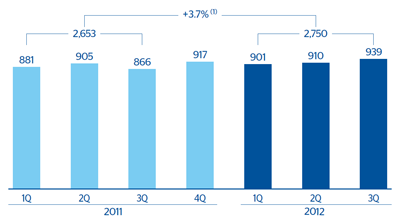
| Operating income |
2,750 |
3.6 |
3.7 |
2,655 |
2,366 |
2.1 |
2.2 |
2,318 |
388 |
13.3 |
13.4 |
342 |
| Impairment on financial assets (net) |
(970) |
6.0 |
6.1 |
(915) |
(970) |
6.0 |
6.1 |
(915) |
- |
- |
- |
- |
| Provisions (net) and other gains (losses) |
(39) |
(20.9) |
(20.8) |
(50) |
(38) |
(20.2) |
(20.1) |
(47) |
(2) |
(34.3) |
(34.2) |
(3) |
| Income before tax |
1,741 |
3.0 |
3.1 |
1,691 |
1,358 |
0.2 |
0.3 |
1,356 |
386 |
13.6 |
13.7 |
340 |
| Income tax |
(439) |
0.4 |
0.5 |
(437) |
(327) |
(3.3) |
(3.2) |
(338) |
(113) |
13.3 |
13.4 |
(100) |
| Net income |
1,302 |
3.9 |
4.0 |
1,254 |
1,032 |
1.3 |
1.4 |
1,018 |
273 |
13.8 |
13.9 |
240 |
| Non-controlling interests |
(2) |
16.9 |
17.0 |
(2) |
(0) |
1.6 |
1.7 |
(0) |
(2) |
12.1 |
12.2 |
(2) |
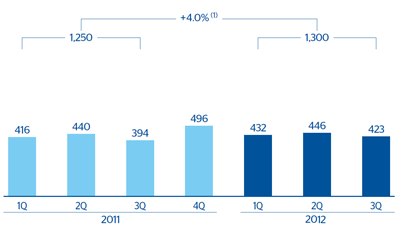
| Net attributable profit |
1,300 |
3.9 |
4.0 |
1,252 |
1,031 |
1.3 |
1.4 |
1,018 |
271 |
13.8 |
13.9 |
238 |
(1) At constant exchange rate.
Balance sheet
(Million euros)
|
|
Units: |
|
Mexico |
Banking Business |
Pensions and Insurance |
|
30-09-12 |
Δ% |
Δ% (1) |
30-09-11 |
30-09-12 |
Δ% |
Δ% (1) |
30-09-11 |
30-09-12 |
Δ% |
Δ% (1) |
30-09-11 |
| Cash and balances with central banks |
5,149 |
2.0 |
(8.9) |
5,047 |
5,149 |
2.0 |
(8.9) |
5,047 |
- |
- |
- |
- |
| Financial assets |
32,480 |
31.8 |
17.7 |
24,640 |
26,261 |
31.2 |
17.2 |
20,013 |
6,490 |
33.6 |
19.3 |
4,860 |
| Loans and receivables |
42,362 |
28.1 |
14.5 |
33,057 |
41,701 |
27.3 |
13.7 |
32,754 |
731 |
108.1 |
85.8 |
352 |
| Loans and advances to customers |
37,941 |
25.3 |
11.9 |
30,275 |
37,745 |
25.3 |
11.9 |
30,123 |
227 |
24.7 |
11.4 |
182 |
| Loans and advances to credit institutions and other |
4,421 |
58.9 |
41.9 |
2,782 |
3,956 |
50.4 |
34.3 |
2,631 |
504 |
197.7 |
165.9 |
169 |
| Tangible assets |
1,167 |
29.5 |
15.7 |
901 |
1,161 |
29.8 |
15.9 |
894 |
6 |
(3.0) |
(13.4) |
6 |
| Other assets |
3,266 |
75.2 |
56.5 |
1,864 |
3,134 |
6.4 |
(4.9) |
2,944 |
156 |
40.7 |
25.7 |
111 |
| Total assets/Liabilities and equity |
84,424 |
28.9 |
15.1 |
65,509 |
77,405 |
25.5 |
12.1 |
61,653 |
7,384 |
38.6 |
23.8 |
5,329 |
| Deposits from central banks and credit institutions |
14,913 |
85.0 |
65.2 |
8,062 |
14,913 |
85.0 |
65.2 |
8,062 |
- |
- |
- |
- |
| Deposits from customers |
36,131 |
15.9 |
3.5 |
31,170 |
36,174 |
16.0 |
3.6 |
31,189 |
- |
- |
- |
- |
| Debt certificates |
4,362 |
12.2 |
0.2 |
3,887 |
4,362 |
12.2 |
0.2 |
3,887 |
- |
- |
- |
- |
| Subordinated liabilities |
4,327 |
95.8 |
74.9 |
2,210 |
4,327 |
28.3 |
14.6 |
3,373 |
- |
- |
- |
- |
| Financial liabilities held for trading |
6,667 |
8.4 |
(3.2) |
6,153 |
6,667 |
8.4 |
(3.2) |
6,153 |
- |
- |
- |
- |
| Other liabilities |
12,827 |
24.0 |
10.7 |
10,348 |
6,134 |
7.5 |
(4.0) |
5,707 |
7,072 |
42.1 |
26.9 |
4,977 |
| Economic capital allocated |
5,198 |
41.2 |
26.2 |
3,680 |
4,829 |
47.1 |
31.4 |
3,283 |
312 |
(11.3) |
(20.7) |
352 |
(1) At constant exchange rate.
Significant ratios
(Percentage)
|
Mexico |
|
30-09-12 |
30-06-12 |
30-09-11 |
| Efficiency ratio |
4.1 |
4.0 |
3.7 |
| NPA ratio |
107.2 |
110.9 |
127.8 |
| NPA coverage ratio |
3 |
3 |
4 |
| Risk premium |
3.46 |
3.40 |
3.59 |
Mexico. Operating income
(Million euros at constant exchange rate)
(1) At current exchange rate: +3.6%.
Mexico. Net attributable profit
(Million euros at constant exchange rate)
(1) At current exchange rate +3.9%