South America highlights in the third quarter
- Favorable performance of lending activity, highly leveraged on loans to individuals.
- Positive performance of customer deposits, especially those with lower-cost.
- Excellent price management.
- Good asset quality.
- Successful issuance of capital on international markets.
Industry Trends
In the third quarter of 2012 the financial system in South America remained sound. Lending has continued to grow, boosted by monetary policies focused on supporting economic activity. Lending continued to grow at a fast pace in all the countries in the region, particularly in Venezuela, Uruguay and Argentina, and also in Colombia, Chile and Peru, although at lower rates. Rising deposits have also reflected strong economic activity, with rates similar to those for lending. Peru has announced measures aimed at increasing its reserve requirements. In Argentina, the Central Bank has established the obligation for banks to keep a minimum credit line for SMEs based on their deposits. Peru together with Argentina have made changes to the method used for calculating their reserve requirements, which will result in an increase in the level of reserves.
With respect to exchange rate movements, there were general appreciations in the average rates for currencies in the region, both in the quarter and over the last 12 months. In terms of final exchange rates, there was a notable general appreciation over the year, but over the quarter this was limited to the Chilean peso. The above has had a positive impact on the year-on-year figures in financial statements and business activity in the area and on the quarterly figures in the income statement. However, the effect of exchange rates on the balance sheet and activity in the quarter is negative. Unless indicated otherwise, all comments below on percentage changes refer to constant exchange rates, with the aim of providing a better understanding of the performance of the business in South America.
Income statement
(Million euros)
|
|
Units: |
|
South America |
Banking business |
Pensions and Insurance |
|
Jan.-Sep. 12 |
Δ% |
Δ% (1) |
Jan.-Sep. 11 |
Jan.-Sep. 12 |
Δ% |
Δ% (1) |
Jan.-Sep. 11 |
Jan.-Sep. 12 |
Δ% |
Δ% (1) |
Jan.-Sep. 11 |
| Net interest income |
3,087 |
36.9 |
25.6 |
2,255 |
3,042 |
37.6 |
26.3 |
2,211 |
45 |
4.9 |
(3.0) |
43 |
| Net fees and commissions |
982 |
25.8 |
16.2 |
780 |
704 |
25.5 |
16.6 |
561 |
283 |
27.1 |
15.7 |
223 |
| Net trading income |
367 |
3.4 |
(4.6) |
355 |
325 |
(2.8) |
(10.9) |
335 |
42 |
101.2 |
106.5 |
21 |
| Other income/expenses |
(158) |
(10.4) |
(21.4) |
(176) |
(292) |
1.5 |
(7.7) |
(288) |
141 |
17.6 |
13.3 |
120 |
| Gross income |
4,278 |
33.1 |
22.7 |
3,214 |
3,779 |
34.1 |
23.5 |
2,818 |
511 |
25.7 |
17.2 |
406 |
| Operating costs |
(1,814) |
24.0 |
15.2 |
(1,463) |
(1,611) |
27.8 |
18.4 |
(1,261) |
(180) |
1.3 |
(5.6) |
(178) |
| Personnel expenses |
(921) |
23.4 |
15.0 |
(747) |
(812) |
26.9 |
18.0 |
(640) |
(90) |
2.9 |
(4.4) |
(87) |
| General and administrative expenses |
(762) |
26.2 |
17.2 |
(604) |
(675) |
31.4 |
21.6 |
(514) |
(83) |
(2.3) |
(8.7) |
(85) |
| Deprecation and amortization |
(131) |
16.3 |
6.6 |
(113) |
(124) |
15.5 |
5.8 |
(107) |
(7) |
32.2 |
22.4 |
(6) |
| Operating income |
2,463 |
40.7 |
29.0 |
1,751 |
2,168 |
39.2 |
27.5 |
1,558 |
330 |
44.7 |
35.0 |
228 |
| Impairment on financial assets (net) |
(409) |
26.9 |
15.7 |
(322) |
(409) |
26.8 |
15.6 |
(322) |
- |
- |
- |
- |
| Provisions (net) and other gains (losses) |
(128) |
194.0 |
166.3 |
(44) |
(124) |
165.4 |
138.4 |
(47) |
(3) |
n.m. |
n.m. |
2 |
| Income before tax |
1,926 |
39.1 |
27.7 |
1,385 |
1,635 |
37.6 |
26.3 |
1,188 |
327 |
42.2 |
32.7 |
230 |
| Income tax |
(433) |
53.4 |
40.6 |
(282) |
(363) |
47.6 |
35.9 |
(246) |
(81) |
67.3 |
53.5 |
(48) |
| Net income |
1,493 |
35.4 |
24.3 |
1,103 |
1,273 |
35.0 |
23.8 |
943 |
246 |
35.5 |
27.0 |
181 |
| Non-controlling interests |
(479) |
37.0 |
25.0 |
(349) |
(419) |
36.2 |
23.8 |
(308) |
(59) |
39.7 |
30.6 |
(42) |
| Net attributable profit |
1,014 |
34.7 |
24.1 |
753 |
853 |
34.4 |
23.8 |
635 |
187 |
34.3 |
25.9 |
139 |
(1) At constant exchange rate.
Balance sheet
(Million euros)
|
|
Units: |
|
South America |
Banking business |
Pensions and Insurance |
|
30-09-12 |
Δ% |
Δ% (1) |
30-09-11 |
30-09-12 |
Δ% |
Δ% (1) |
30-09-11 |
30-09-12 |
Δ% |
Δ% (1) |
30-09-11 |
| Cash and balances with central banks |
9,261 |
18.2 |
12.1 |
7,833 |
9,261 |
18.2 |
12.1 |
7,833 |
- |
- |
- |
- |
| Financial assets |
11,584 |
17.1 |
7.2 |
9,891 |
10,052 |
19.1 |
9.4 |
8,441 |
1,518 |
9.0 |
(1.6) |
1,393 |
| Loans and receivables |
50,245 |
29.3 |
19.7 |
38,853 |
49,821 |
30.3 |
20.6 |
38,238 |
306 |
(20.2) |
(22.7) |
383 |
| Loans and advances to customers |
45,417 |
29.3 |
19.3 |
35,135 |
45,358 |
29.4 |
19.3 |
35,062 |
60 |
(30.1) |
(32.3) |
85 |
| Loans and advances to credit institutions and other |
4,828 |
29.9 |
24.0 |
3,718 |
4,463 |
40.5 |
35.2 |
3,176 |
246 |
(17.4) |
(20.0) |
298 |
| Tangible assets |
880 |
20.8 |
13.3 |
728 |
826 |
22.1 |
14.9 |
677 |
53 |
4.1 |
(7.7) |
51 |
| Other assets |
2,107 |
(14.7) |
(21.5) |
2,469 |
2,044 |
1.8 |
(8.0) |
2,008 |
165 |
8.6 |
0.5 |
151 |
| Total assets/Liabilities and equity |
74,077 |
23.9 |
14.8 |
59,774 |
72,005 |
25.9 |
16.7 |
57,196 |
2,042 |
3.2 |
(5.5) |
1,979 |
| Deposits from central banks and credit institutions |
6,307 |
12.2 |
0.5 |
5,623 |
6,307 |
12.2 |
0.5 |
5,622 |
1 |
(79.9) |
(79.1) |
5 |
| Deposits from customers |
49,434 |
27.2 |
18.9 |
38,866 |
49,591 |
27.2 |
19.0 |
38,983 |
- |
- |
- |
- |
| Debt certificates |
3,459 |
61.4 |
44.4 |
2,144 |
3,459 |
61.4 |
44.4 |
2,144 |
- |
- |
- |
- |
| Subordinated liabilities |
1,223 |
(19.4) |
(26.1) |
1,518 |
1,223 |
12.4 |
(0.2) |
1,088 |
- |
- |
- |
- |
| Financial liabilities held for trading |
1,127 |
(18.0) |
(27.9) |
1,373 |
1,127 |
(18.0) |
(27.9) |
1,373 |
- |
- |
- |
- |
| Other liabilities |
9,421 |
24.3 |
15.3 |
7,582 |
7,350 |
30.9 |
22.5 |
5,616 |
1,887 |
11.9 |
2.6 |
1,685 |
| Economic capital allocated |
3,106 |
16.4 |
8.0 |
2,668 |
2,948 |
24.4 |
15.6 |
2,370 |
154 |
(46.6) |
(51.4) |
289 |
(1) At constant exchange rate.
Significant ratios
(Percentage)
|
South America |
|
30-09-12 |
30-06-12 |
30-09-11 |
| Efficiency ratio |
42.4 |
41.6 |
45.5 |
| NPA ratio |
2.2 |
2.3 |
2.3 |
| NPA coverage ratio |
142 |
139 |
140 |
| Risk premium |
1.26 |
1.12 |
1.31 |
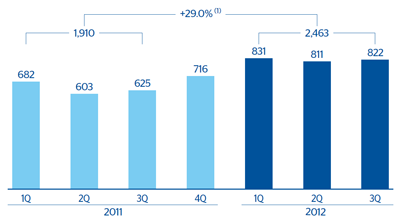
South America. Operating income
(Million euros at constant exchange rate)
(1) At current exchange rates: +40.7%.
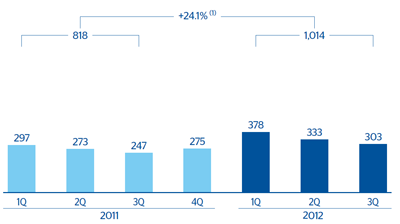
South America. Net attributable profit
(Million euros at constant exchange rate)
(1) At current exchange rates: +34.7%