The United States highlights in the third quarter
- Sustained growth of the loan book.
- Increase in customer deposits.
- Sound capital ratios.
- Significant increase in earnings thanks to favorable evolution of provisions, cost discipline and revenue resilience.
Industry Trends
The health of the banking system continues to improve in the United States. The number of banks experiencing problems has dropped. In addition, asset quality in general maintains a positive trend, with the NPA ratio falling for the ninth quarter in a row to 5.05%, the lowest figure since the fourth quarter of 2008. Asset quality has therefore become a favorable aspect for a growing majority of banks which, generally speaking, have returned to normal levels of provisions and reduced their NPA ratios.
As regards lending, business and industrial sector and car finance continue to post better results than other segments. The residential mortgage portfolio has also seen significant growth, as it has benefited from refinancing associated with government aid. However, as a whole, growth in lending has been modest in the third quarter of 2012, as it has been negatively affected by pressures on prices.
Finally, liquidity and capital levels are at record levels in the country’s financial industry, with capital allocation improved.
As a result, and according to data for the first half of 2012, the banking sector in the United States posted better earnings than in previous periods, although interest rates are expected to remain low and exert pressures on net interest income in the short term. Income from fees and commissions will also be lower as a result of regulatory changes. Against this background, banks have once again focused their attention on cost management. Streamlining of branches and investment in technology have received special attention.
Income statement
(Million euros)
|
|
Units: |
|
The United States |
BBVA Compass |
|
Jan.-Sep. 12 |
Δ% |
Δ% (1) |
Jan.-Sep. 11 |
Jan.-Sep. 12 |
Δ% |
Δ% (1) |
Jan.-Sep. 11 |
| Net interest income |
1,285 |
5.7 |
(3.6) |
1,216 |
1,112 |
5.9 |
(3.0) |
1,044 |
| Net fees and commissions |
463 |
(3.6) |
(11.6) |
480 |
388 |
(1.8) |
(10.7) |
396 |
| Net trading income |
121 |
10.2 |
1.3 |
109 |
97 |
30.5 |
22.0 |
72 |
| Other income/expenses |
(43) |
(28.9) |
(35.2) |
(60) |
(39) |
(30.1) |
(39.3) |
(58) |
| Gross income |
1,826 |
4.6 |
(4.4) |
1,745 |
1,558 |
6.5 |
(2.4) |
1,454 |
| Operating costs |
(1,191) |
8.3 |
(1.1) |
(1,100) |
(1,042) |
7.6 |
(1.2) |
(960) |
| Personnel expenses |
(672) |
12.6 |
2.9 |
(597) |
(590) |
11.1 |
2.3 |
(525) |
| General and administrative expenses |
(386) |
2.3 |
(6.5) |
(377) |
(322) |
2.8 |
(6.1) |
(313) |
| Deprecation and amortization |
(134) |
6.0 |
(3.4) |
(126) |
(130) |
5.4 |
(3.5) |
(122) |
| Operating income |
634 |
(1.7) |
(10.0) |
645 |
517 |
4.1 |
(4.7) |
494 |
| Impairment on financial assets (net) |
(92) |
(67.5) |
(70.4) |
(285) |
(64) |
(68.8) |
(78.5) |
(273) |
| Provisions (net) and other gains (losses) |
(46) |
99.8 |
88.4 |
(23) |
(39) |
n.m. |
n.m. |
(5) |
| Income before tax |
496 |
46.8 |
34.8 |
338 |
413 |
81.8 |
73.9 |
216 |
| Income tax |
(155) |
61.9 |
48.8 |
(96) |
(129) |
112.4 |
104.8 |
(57) |
| Net income |
341 |
40.9 |
29.3 |
242 |
284 |
70.8 |
62.7 |
159 |
| Non-controlling interests |
- |
- |
- |
- |
- |
- |
- |
- |
| Net attributable profit |
341 |
40.9 |
29.3 |
242 |
284 |
70.8 |
62.7 |
159 |
(1) At constant exchange rate.
Balance sheet
(Million euros)
|
|
Units: |
|
The United States |
BBVA Compass |
|
30-09-12 |
Δ% |
Δ% (1) |
30-09-11 |
30-09-12 |
Δ% |
Δ% (1) |
30-09-11 |
| Cash and balances with central banks |
4,514 |
58.5 |
51.8 |
2,847 |
3,538 |
89.1 |
90.6 |
1,778 |
| Financial assets |
7,905 |
(2.3) |
(6.5) |
8,096 |
7,821 |
7.8 |
4.1 |
7,196 |
| Loans and receivables |
39,731 |
(2.1) |
(6.2) |
40,564 |
35,375 |
11.2 |
7.7 |
31,445 |
| Loans and advances to customers |
37,525 |
(3.9) |
(8.0) |
39,054 |
33,532 |
8.7 |
5.0 |
30,588 |
| Loans and advances to credit institutions and other |
2,206 |
46.1 |
39.9 |
1,510 |
1,842 |
103.4 |
105.8 |
857 |
| Inter-area positions |
- |
- |
- |
29 |
414 |
n.m. |
n.m. |
2 |
| Tangible assets |
776 |
(0.8) |
(5.0) |
782 |
762 |
1.9 |
(2.2) |
746 |
| Other assets |
5,993 |
165.3 |
154.0 |
2,259 |
1,820 |
(9.1) |
(13.9) |
2,024 |
| Total assets/Liabilities and equity |
58,919 |
8.0 |
3.4 |
54,577 |
49,729 |
13.6 |
10.3 |
43,190 |
| Deposits from central banks and credit institutions |
7,716 |
(15.8) |
(19.4) |
9,161 |
4,602 |
7.1 |
3.3 |
4,265 |
| Deposits from customers |
38,435 |
4.6 |
0.1 |
36,753 |
37,590 |
14.4 |
11.1 |
32,411 |
| Debt certificates |
- |
- |
- |
348 |
- |
- |
- |
- |
| Subordinated liabilities |
892 |
(22.8) |
(26.1) |
1,156 |
831 |
(9.7) |
(14.6) |
932 |
| Inter-area positions |
621 |
n.m. |
n.m. |
- |
- |
- |
- |
- |
| Financial liabilities held for trading |
444 |
1.2 |
(3.1) |
439 |
434 |
2.0 |
(2.1) |
424 |
| Other liabilities |
7,811 |
120.3 |
110.9 |
3,546 |
3,814 |
37.0 |
35.1 |
2,703 |
| Economic capital allocated |
3,001 |
(5.5) |
(9.5) |
3,174 |
2,458 |
0.1 |
(4.1) |
2,455 |
(1) At constant exchange rate.
Significant ratios
(Percentage)
|
The United States |
|
30-09-12 |
30-06-12 |
30-09-11 |
| Efficiency ratio |
65.2 |
63.8 |
63.0 |
| NPA ratio |
2.4 |
2.8 |
3.8 |
| NPA coverage ratio |
94 |
82 |
69 |
| Risk premium |
0.30 |
0.26 |
0.99 |
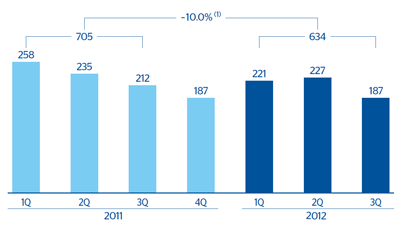
The United States. Operating income
(Million euros at constant exchange rate)
(1) At current exchange rate: –1.7%.
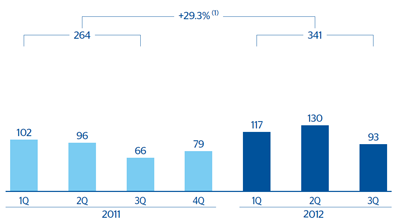
The United States. Net attributable profit (adjusted)
(Million euros at constant exchange rate)
(1) At current exchange rate: +40.9%.