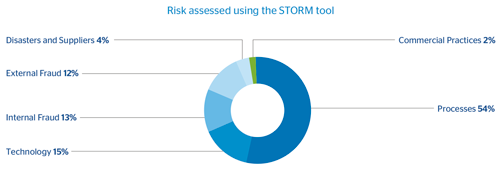
BBVA's operational risk profile is shown below by class of risk after assessing the risks, resulting in the following distribution:
CHART 26: BBVA Group's Operational Risk profile
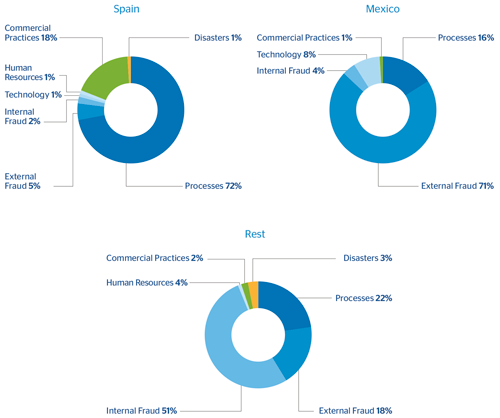
The charts below show the distribution of historical operational losses by class of risk and country, revealing a concentration of losses as a result of the materialization of external fraud events and processes.
CHART 27: Operational Risk profile by risk and country