Eurasia highlights in the second quarter
- Year-on-year comparison affected by the incorporation of Garanti in March 2011.
- Growing and balanced revenue.
- Superior performance of Garanti both in terms of capital strength and asset quality.
Industry Trends
Europe experienced a very complicated situation in the second quarter of 2012 which again affected the banking system in the euro zone. This situation has meant that wholesale funding markets were affected by the high volatility of peripheral country’s risk premiums and successive sovereign rating actions which, in turn, were reflected in those of their financial institutions.
The problem, however, is not limited to the European periphery and has also started to be felt in the so-called “core” countries. Global and coordinated decision-making has therefore become essential. Thus, for example, the IMF stated in its newsletter on June 21, 2012 that in order to achieve a Europe-wide banking union, a common framework for the supervision and implementation of macro-prudential policies is required, as well as a Europe-wide deposit guarantee system and a banking resolution authority.
In Turkey, the banking sector continued to see sustained business growth albeit with lower year-on-year growth rates due to regulatory changes introduced recently by the country’s Central Bank aimed at cooling the economy down. Asset quality continues to show positive performance. Lastly, with the coming into force of Basel II, the system’s capital ratios will be affected. In this regard, the various institutions in the sector have taken steps to align their capital ratios with the requirements of the new regulations.
Income statement
(Million euros)
|
Eurasia |
|
1H12 |
Δ% |
1H11 |
| Net interest income |
382 |
25.3 |
305 |
| Net fees and commissions |
235 |
38.0 |
170 |
| Net trading income |
83 |
14.1 |
72 |
| Other income/expenses |
397 |
42.3 |
279 |
| Gross income |
1,096 |
32.7 |
826 |
| Operating costs |
(369) |
40.0 |
(263) |
| Personnel expenses |
(193) |
31.0 |
(147) |
| General and administrative expenses |
(146) |
50.4 |
(97) |
| Deprecation and amortization |
(30) |
57.1 |
(19) |
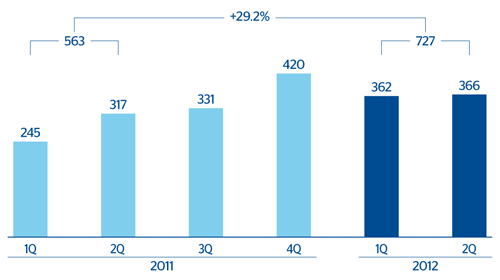
| Operating income |
727 |
29.2 |
563 |
| Impairment on financial assets (net) |
(77) |
48.9 |
(52) |
| Provisions (net) and other gains (losses) |
(20) |
n.m. |
3 |
| Income before tax |
630 |
22.6 |
514 |
| Income tax |
(54) |
(19.4) |
(67) |
| Net income |
576 |
28.9 |
447 |
| Non-controlling interests |
- |
- |
- |
| Net attributable profit |
576 |
28.9 |
447 |
Balance sheet
(Million euros)
|
Eurasia |
|
30-06-12 |
Δ% |
30-06-11 |
| Cash and balances with central banks |
1,746 |
(7.8) |
1,893 |
| Financial assets |
12,492 |
17.0 |
10,679 |
| Loans and receivables |
36,930 |
2.5 |
36,020 |
| Loans and advances to customers |
33,056 |
2.3 |
32,318 |
| Loans and advances to credit institutions and other |
3,874 |
4.7 |
3,702 |
| Inter-area positions |
- |
- |
4,872 |
| Tangible assets |
604 |
2.5 |
589 |
| Other assets |
1,099 |
(10.0) |
1,221 |
| Total assets/Liabilities and equity |
52,872 |
(4.3) |
55,275 |
| Deposits from central banks and credit institutions |
15,563 |
(16.4) |
18,618 |
| Deposits from customers |
20,813 |
(23.0) |
27,035 |
| Debt certificates |
821 |
(0.6) |
826 |
| Subordinated liabilities |
931 |
(46.6) |
1,743 |
| Inter-area positions |
5,607 |
n.m. |
- |
| Financial liabilities held for trading |
461 |
81.4 |
254 |
| Other liabilities |
4,107 |
64.7 |
2,493 |
| Economic capital allocated |
4,569 |
6.1 |
4,306 |
Significant ratios
(Percentage)
|
Eurasia |
|
30-06-12 |
31-03-12 |
30-06-11 |
| Efficiency ratio |
33.7 |
32.3 |
31.9 |
| NPA ratio |
1.4 |
1.6 |
1.3 |
| NPA coverage ratio |
119 |
114 |
144 |
| Risk premium |
0.45 |
0.29 |
0.34 |
Eurasia. Operating income
(Million euros)
Eurasia. Net attributable profit
(Million euros)