South America highlights in the second quarter
- Activity continues to be strong.
- Excellent revenue performance.
- Improved efficiency.
Industry Trends
In the first quarter of 2012, banking activity in South America continued to perform well, driven by strong domestic demand and expansionary monetary policy in the region. Lending is growing at just under 15% year-on-year in Chile, slightly above Colombia and Peru and at a much faster pace in Argentina (up 37%) and Venezuela (up 50%), partly thanks to the lower nominal anchoring in the latter two economies. Deposit gathering also performed strongly, in line with economic growth, with annual rates in Chile, Colombia, Peru and Venezuela similar to those for lending, though lower in Argentina (24%) due to the decline in dollar deposits. Lastly, it is important to note that some countries, such as Colombia and Peru, recently announced measures affecting the financial system such as increasing provisions and reserve requirements to cool down their credit markets in particular and the economy in general.
With respect to exchange rate movements, there were general appreciations in the currencies in the region, both over the quarter and over the last 12 months. This has a positive impact on financial statements in South America. Unless indicated otherwise, all comments below on percentage changes refer to constant exchange rates, with the aim of providing a better understanding of the performance of the business in this area.
Income statement
(Million euros)
|
|
Units: |
|
South America |
Banking business |
Pensions and Insurance |
|
1H12 |
Δ% |
Δ% (1) |
1H11 |
1H12 |
Δ% |
Δ% (1) |
1H11 |
1H12 |
Δ% |
Δ% (1) |
1H11 |
| Net interest income |
1,977 |
37.8 |
28.0 |
1,435 |
1,945 |
38.3 |
28.5 |
1,406 |
32 |
14.8 |
7.1 |
28 |
| Net fees and commissions |
636 |
24.2 |
16.2 |
513 |
455 |
24.0 |
16.5 |
367 |
185 |
21.7 |
13.0 |
152 |
| Net trading income |
241 |
(13.9) |
(19.5) |
280 |
216 |
(11.3) |
(17.8) |
243 |
25 |
(32.5) |
(33.4) |
37 |
| Other income/expenses |
(75) |
(23.0) |
(32.0) |
(98) |
(170) |
(1.1) |
(8.8) |
(172) |
99 |
23.9 |
20.9 |
80 |
| Gross income |
2,779 |
30.5 |
21.9 |
2,130 |
2,446 |
32.6 |
23.6 |
1,845 |
341 |
14.9 |
8.9 |
297 |
| Operating costs |
(1,158) |
21.7 |
14.4 |
(951) |
(1,027) |
26.2 |
18.3 |
(814) |
(117) |
(6.0) |
(11.0) |
(124) |
| Personnel expenses |
(592) |
21.4 |
14.4 |
(488) |
(521) |
26.6 |
19.0 |
(411) |
(58) |
(8.4) |
(13.3) |
(63) |
| General and administrative expenses |
(484) |
23.2 |
15.7 |
(393) |
(430) |
27.8 |
19.7 |
(336) |
(54) |
(5.6) |
(10.6) |
(57) |
| Deprecation and amortization |
(82) |
15.9 |
7.5 |
(71) |
(77) |
15.2 |
6.8 |
(67) |
(5) |
27.7 |
20.1 |
(4) |
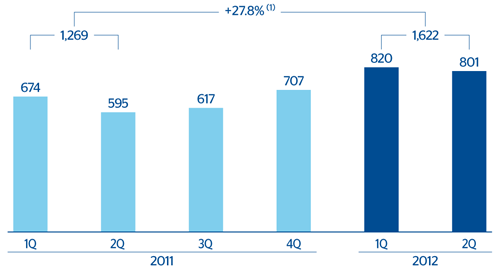
| Operating income |
1,622 |
37.6 |
27.8 |
1,179 |
1,419 |
37.7 |
27.7 |
1,031 |
225 |
29.9 |
23.3 |
173 |
| Impairment on financial assets (net) |
(235) |
12.5 |
3.5 |
(209) |
(234) |
12.4 |
3.4 |
(209) |
(0) |
n.m. |
n.m. |
- |
| Provisions (net) and other gains (losses) |
(75) |
236.3 |
204.8 |
(22) |
(73) |
239.6 |
205.2 |
(21) |
(1) |
n.m. |
n.m. |
3 |
| Income before tax |
1,312 |
38.5 |
29.0 |
948 |
1,112 |
38.9 |
29.2 |
800 |
223 |
27.3 |
20.8 |
175 |
| Income tax |
(288) |
65.4 |
53.4 |
(174) |
(247) |
66.3 |
54.8 |
(148) |
(48) |
41.2 |
31.4 |
(34) |
| Net income |
1,024 |
32.4 |
23.4 |
774 |
865 |
32.7 |
23.3 |
652 |
175 |
23.9 |
18.2 |
142 |
| Non-controlling interests |
(321) |
29.9 |
20.5 |
(247) |
(278) |
29.8 |
19.9 |
(214) |
(42) |
26.2 |
20.2 |
(33) |
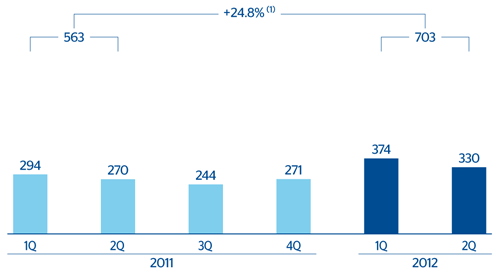
| Net attributable profit |
703 |
33.6 |
24.8 |
526 |
587 |
34.0 |
25.0 |
438 |
133 |
23.2 |
17.6 |
108 |
(1) At constant exchange rate.
Balance sheet
(Million euros)
|
|
Units: |
|
South America |
Banking business |
Pensions and Insurance |
|
30-06-12 |
Δ% |
Δ% (1) |
30-06-11 |
30-06-12 |
Δ% |
Δ% (1) |
30-06-11 |
30-06-12 |
Δ% |
Δ% (1) |
30-06-11 |
| Cash and balances with central banks |
8,453 |
24.6 |
10.8 |
6,786 |
8,453 |
24.6 |
10.8 |
6,786 |
- |
- |
- |
- |
| Financial assets |
11,417 |
37.6 |
24.8 |
8,296 |
9,916 |
45.0 |
31.1 |
6,837 |
1,473 |
4.4 |
(4.3) |
1,412 |
| Loans and receivables |
48,541 |
38.3 |
24.7 |
35,095 |
48,147 |
39.4 |
25.5 |
34,546 |
253 |
(17.9) |
(23.7) |
308 |
| Loans and advances to customers |
43,828 |
37.2 |
23.4 |
31,939 |
43,751 |
37.3 |
23.4 |
31,873 |
78 |
(1.8) |
(8.1) |
80 |
| Loans and advances to credit institutions and other |
4,713 |
49.4 |
37.7 |
3,156 |
47,162 |
37.2 |
23.5 |
34,375 |
251 |
(18.0) |
(23.9) |
306 |
| Tangible assets |
868 |
29.8 |
16.8 |
669 |
817 |
32.2 |
18.6 |
618 |
51 |
0.8 |
(6.3) |
51 |
| Other assets |
2,489 |
18.1 |
9.6 |
2,108 |
1,845 |
9.7 |
0.2 |
1,682 |
136 |
(3.8) |
(11.2) |
142 |
| Total assets/Liabilities and equity |
71,768 |
35.5 |
22.2 |
52,954 |
69,177 |
37.1 |
23.3 |
50,469 |
1,914 |
0.1 |
(7.9) |
1,913 |
| Deposits from central banks and credit institutions |
6,546 |
49.2 |
33.3 |
4,387 |
6,545 |
49.2 |
33.3 |
4,386 |
1 |
(85.4) |
(86.4) |
5 |
| Deposits from customers |
47,752 |
37.6 |
23.6 |
34,706 |
47,882 |
37.6 |
23.6 |
34,808 |
- |
- |
- |
- |
| Debt certificates |
2,819 |
40.3 |
27.7 |
2,009 |
2,819 |
40.3 |
27.7 |
2,009 |
- |
- |
- |
- |
| Subordinated liabilities |
1,794 |
22.4 |
13.6 |
1,465 |
1,192 |
10.0 |
(0.5) |
1,084 |
- |
- |
- |
- |
| Financial liabilities held for trading |
967 |
22.4 |
13.9 |
790 |
967 |
22.4 |
13.9 |
790 |
- |
- |
- |
- |
| Other liabilities |
8,915 |
27.0 |
15.7 |
7,021 |
6,952 |
32.6 |
20.1 |
5,242 |
1,765 |
18.2 |
8.7 |
1,493 |
| Economic capital allocated |
2,976 |
15.5 |
4.1 |
2,577 |
2,820 |
31.1 |
17.6 |
2,151 |
149 |
(64.1) |
(66.9) |
415 |
(1) At constant exchange rate.
Significant ratios
(Percentage)
|
South America |
|
30-06-12 |
31-03-12 |
30-06-11 |
| Efficiency ratio |
41.7 |
40.5 |
44.7 |
| NPA ratio |
2.3 |
2.3 |
2.4 |
| NPA coverage ratio |
139 |
141 |
138 |
| Risk premium |
1.12 |
0.97 |
1.33 |
South America. Operating income
(Million euros at constant exchange rate)
(1) At current exchange rates: +37.6%.
South America. Net attributable profit
(Million euros at constant exchange rate)
(1) At current exchange rates: +33.6%