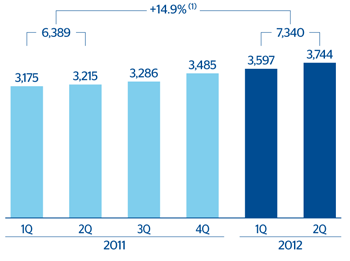
The Group’s net interest income was up again over the quarter, with the cumulative figure to June 2012 standing at €7,340m. This represents a year-on-year increase of 14.9%, supported by the positive performance of this heading in emerging countries and its resilience in developed regions:
- Rising net interest income in Spain, where the cumulative figure stands at 4.0% above that reported 12 months ago, thanks to appropriate price management against the backdrop of a widespread fall in activity and the positive effect of the progressive decline of interest rates taking place in the first six months of the year.
- Positive performance in Eurasia, where the amount for the quarter exceeded the figure for the three previous months by €18m, primarily as a result of the larger volumes of activity at Garanti. In the cumulative total through June it grew at an average annual rate of 25.3%, an increase that can also be explained by the change in the scope of consolidation (Garanti joined the Group on March 22, 2011).
- Sustained growth in Mexico (up 8.7% year-on-year over the six-month period at constant exchange rates), due to increased activity that has been very much focused on the retail portfolio, and the efforts to keep spreads. In the second quarter of 2012 interest rates remained at the same levels, as anticipated. However, higher growth in the portfolios with wider spreads has increased the yield on loans by 6 basis points over the quarter to 13.24%. The focus on more liquid liability products, such as current and savings accounts, has reduced the cost of deposits by 2 points over the same period to 1.63%. As a result, the customer spread rose by 8 points and closed June at 11.61%.
- Significant progress in South America (+28.0% at constant exchange rates), in line with the previous quarters and for the same reasons mentioned at the time: strong business activity and sound price management in an increasingly competitive sector.
- Resilience in the United States, a country where BBVA Compass’ lending activity has shown a slight increase. However, the most significant aspect is the excellent price management, especially taking into account the current environment of very low interest rates and a very flat yield curve. Thus, a slight year-on-year decrease of 3.4% at constant exchange rates of the cumulative net interest income, but resilience over the quarter with an unchanged figure, which ended at the same levels as in the previous quarter. Hence, the customer spread of BBVA Compass increased by 2 basis points from March to June 2012 thanks to the reduction in the cost of deposits, and closed 30-Jun-2012 at 3.96%.