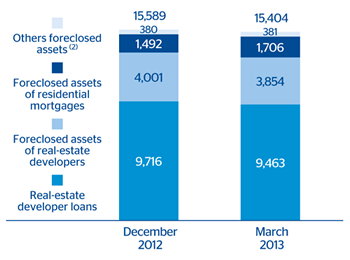
Within this overall situation, BBVA is favorably placed. Its exposure to the real-estate sector is not as great as that of its peers. This is because of a strategy that is consistent with its principles, i.e. based on prudence and management with a lower risk appetite during the credit boom compared to its competitors.
There are two very different realities for the Group within the real-estate sector. On the one hand, net exposure to the developer sector (lending to developers plus the developers’ foreclosed assets) has fallen significantly over the last two years (by 20% since December 2011, or 35% not including the Unnim balances) and will continue to decline in the future. On the other, there are the retail foreclosures, i.e. the foreclosed assets from the residential mortgage sector. Their increase is linked to the increase in gross additions to NPA in this portfolio in 2008 and 2009, and in the short term they are expected to continue to rise.
Having complied with the requirements of Royal Decree-Laws (RDL) 02/2012 and 18/2012 in 2012, BBVA’s net exposure to the real-estate sector in Spain continues to decline, with a fall of 1.2% over the quarter to €15,404m. The Group has increased the funds allocated to cover the loss in value of assets associated with the real-estate industry due to worsening macroeconomic conditions in the country. As a result, at the close of the first three months of 2013 it had improved its coverage of problematic and substandard assets from 43% as of 31-Dec-2012 to 44% as of 31-Mar-2013, and assets from foreclosures and purchases from 51% to 52%, respectively. Total coverage of real-estate exposure closed the quarter at 44% (43% at the close of December 2012).
Around a third of the properties in BBVA’s foreclosed and acquired assets are available for sale. Sales have in fact speeded up since the second half of 2012.
Spain. Real-estate. Net exposure to real-estate (1)
(Million euros)

Coverage of real estate exposure in Spain
(Million of euros as of 31-03-13)
|
|
Risk amount | Provision | % Coverage over risk |
|---|---|---|---|
| NPL + Substandard | 9,263 | 4,121 | 44 |
| NPL | 7,286 | 3,460 | 47 |
| Substandard | 1,977 | 661 | 33 |
| Foreclosed real estate and other assets | 12,323 | 6,382 | 52 |
| From real estate developers | 8,946 | 5,092 | 57 |
| From dwellings | 2,699 | 993 | 37 |
| Other | 678 | 297 | 44 |
| Subtotal | 21,586 | 10,503 | 49 |
| Performing | 5,761 | 1,440 |
|
| With collateral | 5,220 |
|
|
| Finished properties | 3,240 |
|
|
| Construction in progress | 729 |
|
|
| Land | 1,251 |
|
|
| Without collateral and other | 541 |
|
|
| Real estate exposure | 27,347 | 11,943 | 44 |

