

At the close of the fourth quarter of 2013, the Group’s main asset quality indicators have evolved according to forecast:
- An uptick in the NPA ratio in Spain to 10.3% (6.4% excluding real-estate activity) as a result of another decline in the area’s loan book, as non-performing assets were down €145m in the quarter. The coverage ratio remains at the levels reported at the close of 30-Sep-2013.
- In the rest of the geographical areas, improvement in the asset quality indicators in the United States and Mexico, slight deterioration in Eurasia (due to the deleveraging process in Europe and the exchange-rate effect in Turkey) and stability in South America.
As of 31-Dec-2013, the Group’s total risks with customers (including contingent liabilities) totaled €386,401m. This represents a decrease of 1.8% over the quarter and 5.1% over the last twelve months, due basically to the negative impact of exchange rates and a further decline in lending activity in Spain.
Credit risk management (1)
(Million euros)
|
|
31-12-13 | 30-09-13 | 30-06-13 | 31-03-13 | 31-12-12 |
|---|---|---|---|---|---|
| Non-performing assets | 26,243 | 26,508 | 22,226 | 21,808 | 20,603 |
| Total risks | 386,401 | 393,556 | 401,794 | 410,840 | 407,126 |
| Provisions | 15,715 | 15,777 | 15,093 | 15,482 | 14,804 |
| Specific | 13,030 | 12,439 | 11,084 | 10,578 | 9,752 |
| Generic and country-risk | 2,684 | 3,338 | 4,009 | 4,904 | 5,052 |
| NPA ratio (%) | 6.8 | 6.7 | 5.5 | 5.3 | 5.1 |
| NPA coverage ratio (%) | 60 | 60 | 68 | 71 | 72 |
| NPA ratio (%) (excluding real-estate activity in Spain) | 4.6 | 4.6 | 3.8 | 3.6 | 3.5 |
| NPA coverage ratio (%) (excluding real-estate activity in Spain) | 59 | 58 | 64 | 68 | 66 |
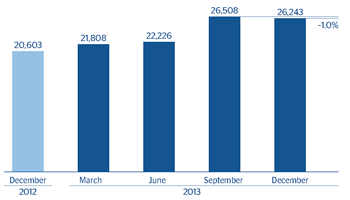
The balance of non-performing assets as of 31-Dec-2013 was €26,243m, very similar to the €26,508m reported at the close of September 2013. This was due to the effect of exchange rates and to the fact that non-performing loans in Spain fell slightly in relation to the figure posted at the end of the preceding quarter, when there had been a significant increase as a result of the classification of refinanced loans in both banking and real-estate activity. In terms of variation in NPA, gross additions declined and recoveries increased over the last 3 months, with net additions to NPA ending the period at €993m, a 80.7% reduction compared to the figure at the close of September. As a result, the ratio of recoveries to gross additions to NPA stood at 69.5% as of 31-Dec-2013.
Non-performing assets evolution
(Million euros)
|
|
4Q13 | 3Q13 | 2Q13 | 1Q13 | 4Q12 |
|---|---|---|---|---|---|
| Beginning balance | 26,508 | 22,226 | 21,808 | 20,603 | 20,114 |
| Entries | 3,255 | 7,094 | 4,075 | 3,603 | 4,041 |
| Recoveries | (2,261) | (1,956) | (1,964) | (1,659) | (2,400) |
| Net variation | 993 | 5,138 | 2,112 | 1,944 | 1,642 |
| Write-offs | (1,102) | (817) | (1,282) | (655) | (1,172) |
| Exchange rate differences and other | (155) | (39) | (412) | (84) | 19 |
| Period-end balance | 26,243 | 26,508 | 22,226 | 21,808 | 20,603 |
| Memorandum item: |
|
|
|
|
|
| Non-performing loans | 25,826 | 26,109 | 21,810 | 21,448 | 20,287 |
| Non-performing contingent liabilities | 418 | 399 | 416 | 361 | 317 |
Non-performing assets
(Million euros)
The Group’s NPA ratio ended December 2013 at 6.8% (4.6% excluding real-estate activity in Spain), a slight increase of 6 basis points over the last 3 months. This was due mainly to the aforementioned decline in lending activity in Spain. The NPA ratio of the banking business in the country stands at 6.4%, up 24 basis points over the quarter. The ratio in real-estate activity in Spain closed the quarter at 55.5% (55.3% as of 30-Sep-2013). In Eurasia, the NPA ratio closed December at 3.4% (2.9% as of 30-Sep-2013). In the United States and Mexico, this ratio improved over the quarter to 1.2% and 3.6%, respectively, as of 31-Dec-2013. Lastly, in South America, the NPA ratio remained stable and closed the year at 2.1% (2.2% as of 30-Sep-2013).
Lastly, coverage provisions for risks with customers totaled €15,715m as of 31-Dec-2013, practically the same figure registered at the end of September (€15,777m), bringing the Group’s coverage ratio to the same level reported at the close of the previous quarter, at 60%. By business areas, the ratio increased significantly in the United States, from 120% to 134%, in Mexico, to 110% (105% as of 30-Sep-2013) and in South America, to 141% (137% at the end of the third quarter of 2013). It has remained stable in Spain and Eurasia, at 41% and 87%, respectively, at the end of 2013 (41% and 91%, respectively, at the close of the third quarter of 2013). In real-estate activity in Spain it stands at 61% (62% at the end of September).
NPA and coverage ratios (1)
(Percentage)
