Solvency
Solid capital position
CET1 Ratio evolution
(%, phased-in)
High quality capital
(%)
RWAs/ Total Assets
Leverage ratio
European Peer Group: BARC, BNPP, CASA, CS, CMZ, DB, HSBC, ISP, LBG, RBS, SAN, SG, UBS, UCG. Figures as of September 2015
Well above 2016 ECB minimum requirement
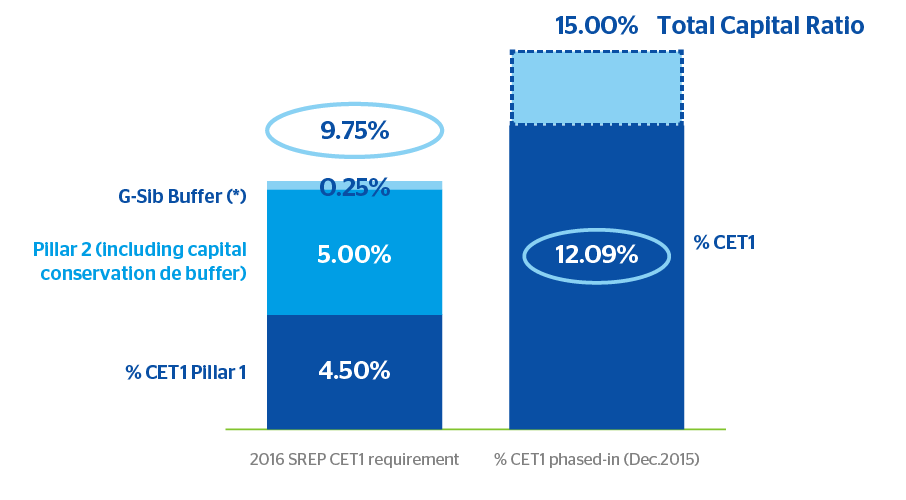
+234 bps CET1 buffer above SREP requirement
(*) BBVA has been excluded from the Financial Stability Board from G-SIB list with effect as of 1st January 2017. Therefore, this G-SIB buffer will no longer be applicable to BBVA. Nevertheless, Bank of Spain has communicated to BBVA its consideration as a domestic systemic financial institution (D-SIB) and it is required to hold a D-SIB buffer of 0.5% on a consolidated basis. This buffer will be phased-in in four years and will be fully implemented in 2019.
A detailed explanation about the Group's solvency can be found in the Consolidated Annual Accounts, the Management Report and the Auditors´ Report and in the Pillar III report.
