

Highlights in 2013
- Positive performance of activity, both in lending and customer funds, in almost every country in the region.
- Maintenance of spreads.
- Favourable performance of revenue.
- Stability of risk indicators.
- Sale of the pension business and BBVA Panama.
Key role in diversification and income contribution
Income statement
(Million euros)
 Download Excel
| South America | |||||
|---|---|---|---|---|---|
|
|
2013 | Δ% | Δ% (1) | 2012 | 2011 |
| Net interest income | 4,703 | 9.7 | 33.6 | 4,288 | 3,159 |
| Net fees and commissions | 976 | 6.9 | 27.7 | 913 | 722 |
| Net trading income | 764 | 72.3 | 100.7 | 443 | 485 |
| Other income/expenses | (812) | 185.8 | n.m. | (284) | (267) |
| Gross income | 5,630 | 5.0 | 25.3 | 5,360 | 4,099 |
| Operating expenses | (2,386) | 4.0 | 23.2 | (2,293) | (1,884) |
| Personnel expenses | (1,184) | 3.1 | 20.9 | (1,148) | (958) |
| General and administrative expenses | (1,029) | 5.9 | 25.9 | (972) | (774) |
| Depreciation and amortization | (173) | (0.5) | 23.5 | (173) | (152) |
| Operating income | 3,244 | 5.8 | 27.0 | 3,066 | 2,215 |
| Impairment on financial assets (net) | (701) | 18.3 | 39.2 | (593) | (449) |
| Provisions (net) and other gains (losses) | (157) | (22.6) | 12.8 | (202) | (89) |
| Income before tax | 2,387 | 5.1 | 24.8 | 2,271 | 1,677 |
| Income tax | (530) | 7.4 | 24.6 | (494) | (346) |
| Net income | 1,856 | 4.5 | 24.8 | 1,777 | 1,332 |
| Non-controlling interests | (608) | 5.1 | 29.5 | (578) | (434) |
| Net attributable profit | 1,249 | 4.1 | 22.6 | 1,199 | 898 |
Balance sheet
(Million euros)
Download Excel
|
|
South America | ||||
|---|---|---|---|---|---|
|
|
31-12-13 | Δ% | Δ% (1) | 31-12-12 | 31-12-11 |
| Cash and balances with central banks | 13,507 | 4.6 | 37.0 | 12,908 | 8,335 |
| Financial assets | 9,765 | (3.8) | 18.8 | 10,146 | 8,389 |
| Loans and receivables | 51,881 | 0.5 | 23.4 | 51,638 | 42,939 |
| Loans and advances to customers | 46,962 | (0.4) | 21.8 | 47,146 | 38,824 |
| Loans and advances to credit institutions and others | 4,919 | 9.5 | 40.4 | 4,492 | 4,114 |
| Tangible assets | 943 | 7.1 | 37.4 | 881 | 759 |
| Other assets | 2,043 | 7.5 | 30.3 | 1,901 | 2,229 |
| Total assets/Liabilities and equity | 78,141 | 0.9 | 25.2 | 77,474 | 62,651 |
| Deposits from central banks and credit institutions | 4,589 | (22.8) | (11.1) | 5,947 | 5,205 |
| Deposits from customers | 55,167 | 2.4 | 29.7 | 53,870 | 42,468 |
| Debt certificates | 3,556 | 9.0 | 24.9 | 3,263 | 2,282 |
| Subordinated liabilities | 1,252 | 4.7 | 19.6 | 1,196 | 1,568 |
| Financial liabilities held for trading | 1,069 | 11.9 | 27.8 | 955 | 1,006 |
| Other liabilities | 9,302 | 2.5 | 25.5 | 9,074 | 7,323 |
| Economic capital allocated | 3,205 | 1.1 | 25.5 | 3,169 | 2,798 |
Relevant business indicators
(Million euros and percentage)
Download Excel
|
|
South America | ||
|---|---|---|---|
|
|
31-12-13 | 31-12-12 | 31-12-11 |
| Performing loans (1) | 47,753 | 39,241 | 33,479 |
| Customer deposits under management (1-2) | 58,881 | 45,306 | 36,846 |
| Mutual funds | 2,952 | 3,355 | 2,829 |
| Pension funds | 3,600 | 3,081 | 2,661 |
| Efficiency ratio (%) | 42.4 | 42.8 | 46.0 |
| NPA ratio (%) | 2.1 | 2.1 | 2.2 |
| NPA coverage ratio (%) | 141 | 146 | 146 |
| Risk premium (%) | 1.49 | 1.34 | 1.31 |
(2) Excluding repos and including specific marketable debt securities.
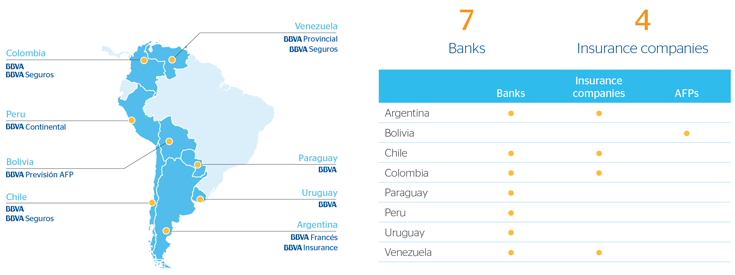
BBVA footprint in South America
South America. Data per country
(Million euros)
Download Excel
| Country | Operating income | Net attributable profit | ||||||||
|---|---|---|---|---|---|---|---|---|---|---|
|
|
2013 | ∆% | ∆% at constant exchange rates |
2012 | 2011 | 2013 | ∆% | ∆% at constant exchange rates |
2012 | 2011 |
| Argentina | 509 | 15.3 | 43.6 | 442 | 315 | 214 | 11.8 | 39.2 | 191 | 156 |
| Chile | 336 | 7.4 | 13.2 | 313 | 299 | 119 | (20.9) | (16.7) | 151 | 139 |
| Colombia | 525 | 1.9 | 9.4 | 516 | 379 | 296 | 0.3 | 7.8 | 295 | 230 |
| Peru | 651 | 1.4 | 7.4 | 642 | 492 | 167 | (2.3) | 3.5 | 170 | 141 |
| Venezuela | 1,116 | 5.1 | 53.2 | 1,061 | 670 | 369 | 11.9 | 63.1 | 329 | 201 |
| Other countries (1) | 108 | 15.9 | 19.7 | 93 | 60 | 84 | 36.5 | 41.2 | 62 | 31 |
| Total | 3,244 | 5.8 | 27.0 | 3,066 | 2,215 | 1,249 | 4.1 | 22.6 | 1,199 | 898 |
