

BBVA Group Highlights
(Consolidated figures)
 Download Excel
|
|
31-12-13 | Δ% | 31-12-12 | 31-12-11 |
|---|---|---|---|---|
| Balance sheet (million euros) | ||||
| Total assets | 599,482 | (6.0) | 637,785 | 597,688 |
| Loans and advances to customers (gross) | 350,110 | (4.7) | 367,415 | 361,310 |
| Deposits from customers | 310,176 | 6.0 | 292,716 | 282,173 |
| Other customer funds (1) | 99,213 | 8.1 | 91,774 | 85,962 |
| Total customer funds (1) | 409,389 | 6.5 | 384,491 | 368,135 |
| Total equity | 44,815 | 2.3 | 43,802 | 40,058 |
| Income statement (million euros) | ||||
| Net interest income | 14,613 | (3.4) | 15,122 | 13,152 |
| Gross income | 21,397 | (2.3) | 21,892 | 19,528 |
| Operating income | 10,196 | (8.2) | 11,106 | 9,791 |
| Income before tax | 2,750 | 267.3 | 749 | 2,946 |
| Net attributable profit | 2,228 | 32.9 | 1,676 | 3,004 |
| Data per share and share performance ratios | ||||
| Share price (euros) | 8.95 | 28.6 | 6.96 | 6.68 |
| Net attributable profit per share (euros) (2) | 0.39 | 24.3 | 0.31 | 0.60 |
| Book value per share (euros) | 8.18 | 1.8 | 8.04 | 8.35 |
| P/BV (Price/book value; times) | 1.1 |
|
0.9 | 0.8 |
| PER (Price/earnings; times) | 23.2 |
|
21.5 | 10.9 |
| Yield (Dividend/price; %) | 4.1 |
|
6.0 | 6.3 |
| Significant ratios (%) | ||||
| ROE (Net attributable profit/average equity) | 5.0 |
|
4.0 | 8.0 |
| ROTE (Net attributable profit/average tangible equity) | 6.0 |
|
5.0 | 10.7 |
| ROA (Net income/average total asets) | 0.48 |
|
0.37 | 0.61 |
| RORWA (Net income/average risk-weighted assets) | 0.91 |
|
0.70 | 1.08 |
| Efficiency ratio | 52.3 |
|
49.3 | 49.9 |
| Risk premium | 1.59 |
|
2.15 | 1.20 |
| NPA ratio | 6.8 |
|
5.1 | 4.0 |
| NPA coverage ratio | 60 |
|
72 | 61 |
| Capital adequacy ratios (%) | ||||
| Core capital | 11.6 |
|
10.8 | 10.3 |
| Tier I | 12.2 |
|
10.8 | 10.3 |
| BIS II ratio | 14.9 |
|
13.0 | 12.9 |
| Non financial indicators (3) | ||||
| Global employee satisfaction index (%) | 76 |
|
76 | 73 |
| Gender diversity (ratio of women in the staff; %) | 53 |
|
53 | 52 |
| Socially responsible mutual funds (SRI) (%) | 5.1 |
|
2.6 | 2.4 |
| Attributable profit dedicated to social programs (%) | 4.4 |
|
4.8 | 2.5 |
| Number of beneficiaries of the financial literacy Plan | 256,359 |
|
251,637 | 123,768 |
| Number of microentepreneurs supported by the BBVA Microfinance foundation | 1,493,709 |
|
1,293,514 | 948,508 |
| Other information | ||||
| Number of shares (millions) | 5,786 | 6.2 | 5,449 | 4,903 |
| Number of shareholders | 974,395 | (3.8) | 1,012,864 | 987,277 |
| Number of employees (4) | 109,305 | (5.7) | 115,852 | 110,645 |
| Number of branches (4) | 7,512 | (5.8) | 7,978 | 7,457 |
| Number of ATMs (4) | 20,415 | 1.2 | 20,177 | 18,794 |
(2) Basic earnings per share which includes the eventual dilution of the contingent convertible securities into shares, issued in the second quarter of 2013.
(3) More details are provided in the information on corporate responsibility 2013 included in the web page www.bancaparatodos.com.
(4) Excluding Garanti.
Download Excel
| Profit-adjusted information (1) | 31-12-13 | Δ% | 31-12-12 | 31-12-11 |
|---|---|---|---|---|
| Net attributable profit | 3,195 | (28.9) | 4,490 | 4,127 |
| Net attributable profit per share (euros) (2) | 0.56 | (29.7) | 0.80 | 0.81 |
| ROE | 7.1 | 10.7 | 10.9 | |
| ROTE | 8.6 | 13.4 | 14.7 | |
| ROA | 0.64 | 0.82 | 0.81 | |
| RORWA | 1.20 | 1.54 | 1.43 |
(2) Basic earnings per share which includes the eventual dilution of the contingent convertible securities into shares, issued in the second quarter of 2013.
Net interest income plus fees and commissions(Million euros) 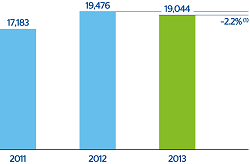
(1) At constant exchange rates: +3.5%. |
Efficiency ratio(Percentage) 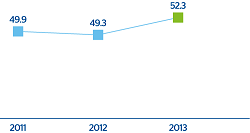
|
|---|---|
Net attributable profit(Million euros) 
(1) At constant exchange rates: +55.1%. |
Net attributable profit per share (1)(Euros) 
(1) Basic earnings per share which includes the eventual dilution of the contingent convertible securities into shares, issued in the second quarter of 2013. |
Core capital(Million euros) 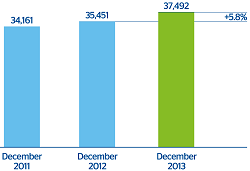
|
Core capital ratio(Percentage) 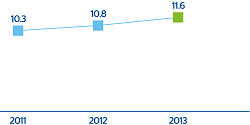
|
