

BBVA’s gross income was €21,397m between January and December 2013, a year-on-year decline of 2.3%, but an increase of 2.6% excluding the depreciation of currencies against the euro. This positive performance was underpinned, as mentioned above, by strong recurring revenue (net interest income plus income from fees and commissions).
BBVA Group. Gross income
(Million euros)

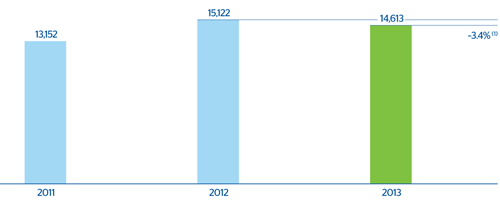
Net interest income exhibits solid resilience, despite the negative impact of the elimination (mentioned above) of the “floor clauses” on May 9. The improvement in the cost of funding (wholesale and retail), strong activity in emerging markets and the United States, and the maintenance of customer spreads are behind this resilience in net interest income. This heading stands at €14,613m, a decline of 3.4% on the figure for the same period in 2012. Excluding the exchange-rate effect, it grew by 2.7% over the same period.
BBVA Group. Net interest income
(Million euros)
Breakdown of yields and costs
 Download Excel
|
|
2013 | 2012 | 2011 | |||
|---|---|---|---|---|---|---|
|
|
% s/ATA | % yield/Cost | % s/ATA | % yield/Cost | % s/ATA | % yield/Cost |
| Cash and balances with central banks | 4.6 | 0.92 | 4.2 | 0.99 | 3.7 | 1.18 |
| Financial assets and derivatives | 27.0 | 2.82 | 26.8 | 2.87 | 24.9 | 2.99 |
| Loans and advances to credit institutions | 4.4 | 1.59 | 4.2 | 1.79 | 4.6 | 2.42 |
| Loans and advances to customers | 56.2 | 5.57 | 57.5 | 5.72 | 60.1 | 5.51 |
| Euros | 33.3 | 2.84 | 34.8 | 3.34 | 38.7 | 3.40 |
| Domestic | 27.5 | 3.26 | 28.8 | 3.79 | 33.8 | 3.69 |
| Other | 5.9 | 0.86 | 6.1 | 1.22 | 4.9 | 1.40 |
| Foreign currencies | 22.9 | 9.55 | 22.7 | 9.39 | 21.5 | 9.31 |
| Other assets | 7.8 | 0.28 | 7.3 | 0.44 | 6.5 | 0.58 |
| Total assets | 100.0 | 4.02 | 100.0 | 4.21 | 100.0 | 4.25 |
| Deposits from central banks and credit institutions | 14.7 | 1.90 | 17.3 | 2.14 | 13.6 | 2.63 |
| Deposits from customers | 48.7 | 1.67 | 45.4 | 1.84 | 48.7 | 2.04 |
| Euros | 25.2 | 1.26 | 23.5 | 1.34 | 27.0 | 1.58 |
| Domestic | 18.0 | 1.44 | 15.3 | 1.57 | 16.9 | 1.66 |
| Other | 7.1 | 0.80 | 8.2 | 0.90 | 10.1 | 1.43 |
| Foreign currencies | 23.7 | 2.01 | 21.9 | 2.38 | 21.7 | 2.62 |
| Debt certificates and subordinated liabilities | 15.5 | 2.74 | 16.7 | 2.71 | 19.3 | 2.38 |
| Other liabilities | 13.5 | 1.06 | 13.8 | 0.94 | 11.6 | 1.11 |
| Equity | 7.6 | - | 6.9 | - | 6.8 | - |
| Total liabilities and equity | 100.0 | 1.66 | 100.0 | 1.79 | 100.0 | 1.94 |
| Net interest income/Average total assets (ATA) | 2.36 | 2.42 | 2.31 | |||
Income from fees and commissions totaled €4,431m in the year, up 1.8% in year-on-year terms. This is despite laws restricting some types of fees coming into force in certain geographical areas, with a negative impact on this heading.
Net fees and commissions
(Million euros)
Download Excel
|
|
2012 | ∆% | 2011 | 2010 |
|---|---|---|---|---|
| Mutual funds, pension funds and customer portfolios | 715 | 5.2 | 680 | 689 |
| Banking services | 3,716 | 1.2 | 3,674 | 3,342 |
| Maintenance, collection and payment services | 1,125 | (1.0) | 1,137 | 1,058 |
| Credit and debit cards | 1,292 | 11.7 | 1,157 | 1,030 |
| Securities | 506 | (3.8) | 526 | 499 |
| Contingent liabilities | 307 | (4.8) | 322 | 289 |
| Insurance | 212 | 6.4 | 199 | 168 |
| Other fees and commissions | 275 | (17.7) | 334 | 298 |
| Net fees and commissions | 4,431 | 1.8 | 4,353 | 4,031 |
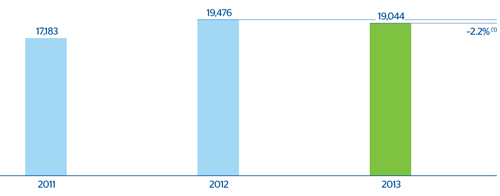
Overall, the Group has demonstrated a high level of resilience and great capacity to generate recurring revenues, which over the year as a whole amounted to €19,044m. This figure is 2.2% down on the same period in 2012, but up 3.5% excluding the exchange-rate effect.
BBVA Group. Net interest income plus fees and commissions
(Million euros)
Thanks to positive market activity and good management of structural risks, NTI stands at €2,527m, 43.0% above the figure for the same period the previous year.
The dividends heading stood at €365m, 30.7% below the figure for 2012, as a result of the temporary suspension in July 2012 of the dividend from the stake in Telefónica. This remuneration was resumed in November 2013, as planned.
Income by the equity method stands at €72m for 2013. This figure does not include the earnings from CNCB, as with the aforementioned signing of the agreement with CITIC, BBVA’s current stake in CNCB is now classified as available-for-sale. To guarantee a homogenous comparison the historical series have been reconstructed, transferring income by the equity method (excluding dividends) from CNCB corresponding to periods previous to the signature of the sale agreement to the new heading of earnings from corporate operations, as mentioned at the start of this chapter.
Lastly, other operating income and expenses, at a negative €612m for the year, reflect the good performance of the insurance business in all the geographical areas, although also a more negative effect than in 2012 of hyperinflation in Venezuela. Another negative influence is the increased contribution to the deposit guarantee schemes in the different regions where BBVA operates, including the one-off payment in the fourth quarter to the Spanish Deposit Guarantee Fund in compliance with Royal Decree-Law 6/2013, dated March 22.
