

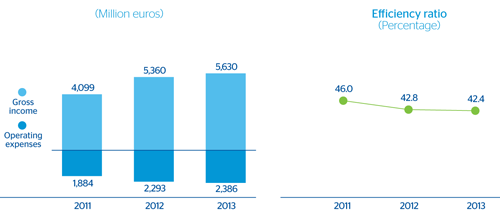
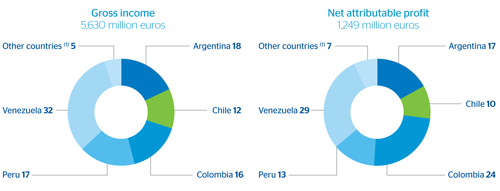
Gross income for 2013 amounted to €5,630m, 25.3% up on the figure for the same period the previous year. This positive performance is a result of the area’s capacity to generate recurring revenue, thanks to the boost to activity in all geographical areas and the maintenance of customer spreads. Net interest income for 2013 stood at €4,703m (up 33.6% year-on-year) and income from fees and commissions is up 27.7% to €976m. NTI also performed very well, doubling the figure for the previous year, largely influenced by the revaluation of BBVA Provincial’s U.S. dollar positions in Venezuela, due to the aforementioned devaluation of the bolivar. Lastly, other income/expenses has been weaker in the year as the adjustment for hyperinflation in Venezuela was more negative than in 2012, which offset the good performance in the insurance business in the area.
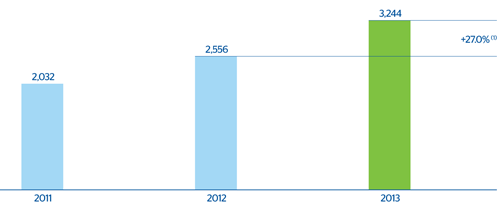
On the side of costs, South America is continuing with its expansion and technological transformation plans in order to make the most of the growth opportunities presented by the region. An example of this is the launch of the new Strategic Plan for 2013-2016. These factors, combined with the inflation in the area, explain why operating expenses have remained high, with a year-on-year increase of 23.2% to €2,386m. The efficiency ratio has remained at levels similar to those registered in 2012, ending at 42.4% (42.8% one year previously). Finally, operating income stands at €3,244m, up 27.0% on the figure reported in the same period in 2012.
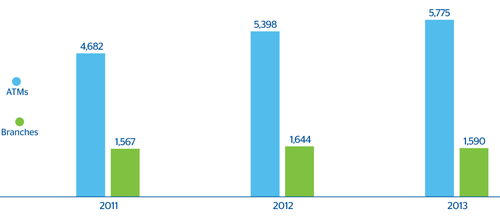
South America. Evolution of branch network and ATMs
South America. Efficiency
South America. Operating income
(Million euros at constant exchange rates)
Impairment losses on financial assets increased significantly to €701m, due to the high level of recoveries and one-off items booked in 2012. Not including these effects, the growth of 26% is in line with the strength of activity.
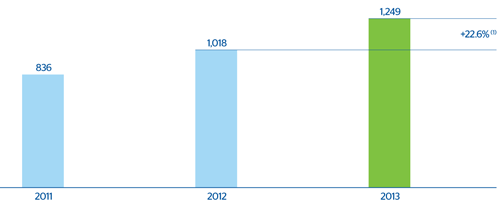
Overall, South America generated a net attributable profit in 2013 of €1,249m, a year-on-year rise of 22.6%.
South America. Net attributable profit
(Million euros at constant exchange rates)
Below are some of the most important aspects of the performance of the various countries in 2013.
South America. Breakdown of gross income and net attributable profit by countries
(2013. Percentage)
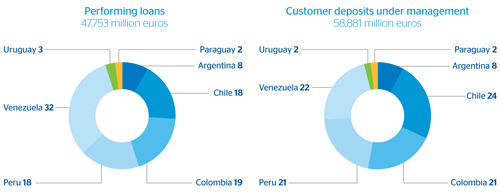
South America. Breakdown of performing loans and customer deposits
(2013. Percentage)
South America. Financial statements of the main countries. Income statement
(Million euros)
 Download Excel
|
|
Argentina | Chile | Colombia | Peru | Venezuela | |||||||||||||||
|---|---|---|---|---|---|---|---|---|---|---|---|---|---|---|---|---|---|---|---|---|
|
|
2013 | Δ% | Δ%(1) | 2012 | 2013 | Δ% | Δ%(1) | 2012 | 2013 | Δ% | Δ%(1) | 2012 | 2013 | Δ% | Δ%(1) | 2012 | 2013 | Δ% | Δ%(1) | 2012 |
| Net interest income | 557 | (3.2) | 20.5 | 575 | 482 | 6.4 | 12.1 | 453 | 728 | 7.0 | 15.0 | 681 | 678 | 1.9 | 7.9 | 665 | 2,060 | 19.7 | 74.6 | 1,720 |
| Net fees and commissions | 220 | (3.8) | 19.8 | 229 | 90 | 6.3 | 12.0 | 85 | 100 | (12.8) | (6.3) | 115 | 182 | 2.9 | 9.0 | 177 | 323 | 26.8 | 84.8 | 255 |
| Net trading income | 153 | 153.6 | 215.8 | 60 | 60 | 159.0 | 172.8 | 23 | 57 | (33.3) | (28.3) | 85 | 140 | 9.0 | 15.5 | 128 | 336 | 195.0 | n.m. | 114 |
| Other income/expenses | 83 | 19.9 | 49.3 | 69 | 27 | (60.3) | (58.2) | 67 | 26 | 223.9 | 248.0 | 8 | (13) | 5.8 | 12.0 | (13) | (938) | 131.9 | 238.1 | (404) |
| Gross income | 1,013 | 8.5 | 35.1 | 934 | 659 | 4.9 | 10.5 | 628 | 911 | 2.5 | 10.2 | 889 | 986 | 3.0 | 9.1 | 958 | 1,781 | 5.7 | 54.1 | 1,685 |
| Operating expenses | (503) | 2.4 | 27.5 | (492) | (323) | 2.5 | 7.9 | (316) | (386) | 3.4 | 11.1 | (373) | (335) | 6.3 | 12.6 | (316) | (665) | 6.8 | 55.6 | (623) |
| Personnel expenses | (277) | 2.4 | 27.5 | (270) | (176) | (1.1) | 4.2 | (178) | (176) | 5.1 | 12.9 | (167) | (176) | 4.3 | 10.4 | (169) | (276) | 3.9 | 51.4 | (266) |
| General and administrative expenses | (208) | 3.2 | 28.5 | (202) | (135) | 7.1 | 12.8 | (126) | (178) | 2.1 | 9.7 | (175) | (136) | 9.4 | 15.9 | (124) | (312) | 13.0 | 64.7 | (276) |
| Depreciation and amortization | (19) | (5.8) | 17.3 | (20) | (12) | 6.7 | 12.4 | (11) | (31) | 1.7 | 9.2 | (31) | (23) | 4.0 | 10.2 | (22) | (77) | (5.0) | 38.6 | (81) |
| Operating income | 509 | 15.3 | 43.6 | 442 | 336 | 7.4 | 13.2 | 313 | 525 | 1.9 | 9.4 | 516 | 651 | 1.4 | 7.4 | 642 | 1,116 | 5.1 | 53.2 | 1,061 |
| Impairment on financial assets (net) | (67) | 22.4 | 52.5 | (55) | (158) | 76.3 | 85.7 | (89) | (126) | 11.1 | 19.3 | (113) | (145) | 4.3 | 10.5 | (139) | (187) | 1.2 | 47.6 | (185) |
| Provisions (net) and other gains (losses) | (16) | 6.3 | 32.3 | (15) | 10 | 44.4 | 52.1 | 7 | 17 | 59.5 | 71.4 | 10 | (9) | 120.2 | 133.2 | (4) | (164) | (15.5) | 23.3 | (194) |
| Income before tax | 426 | 14.6 | 42.7 | 371 | 188 | (18.2) | (13.8) | 230 | 416 | 0.8 | 8.3 | 413 | 497 | (0.4) | 5.5 | 499 | 764 | 12.0 | 63.3 | 682 |
| Income tax | (148) | 21.9 | 51.8 | (121) | (31) | (12.9) | (8.2) | (35) | (107) | 2.6 | 10.2 | (105) | (133) | 0.9 | 6.9 | (132) | (101) | 15.3 | 68.1 | (87) |
| Net income | 278 | 11.0 | 38.3 | 250 | 157 | (19.2) | (14.8) | 195 | 309 | 0.2 | 7.6 | 308 | 364 | (0.8) | 5.0 | 367 | 663 | 11.6 | 62.6 | 595 |
| Non-controlling interests | (64) | 8.6 | 35.2 | (59) | (38) | (13.2) | (8.6) | (44) | (13) | (2.2) | 5.1 | (13) | (198) | 0.4 | 6.4 | (197) | (295) | 11.2 | 62.1 | (265) |
| Net attributable profit | 214 | 11.8 | 39.2 | 191 | 119 | (20.9) | (16.7) | 151 | 296 | 0.3 | 7.8 | 295 | 167 | (2.3) | 3.5 | 170 | 369 | 11.9 | 63.1 | 329 |
Balance sheet
(Million euros)
Download Excel
|
|
Argentina | Chile | Colombia | Peru | Venezuela | |||||||||||||||
|---|---|---|---|---|---|---|---|---|---|---|---|---|---|---|---|---|---|---|---|---|
|
|
31-12-13 | Δ% | Δ% (1) | 31-12-12 | 31-12-13 | Δ% | Δ% (1) | 31-12-12 | 31-12-13 | Δ% | Δ% (1) | 31-12-12 | 31-12-13 | Δ% | Δ% (1) | 31-12-12 | 31-12-13 | Δ% | Δ% (1) | 31-12-12 |
| Cash and balances with central banks | 1,434 | 7.0 | 48.5 | 1,341 | 419 | 10.1 | 25.7 | 381 | 876 | (43.0) | (34.9) | 1,537 | 2,829 | (20.6) | (9.2) | 3,565 | 7,257 | 31.2 | 101.1 | 5,531 |
| Financial assets | 362 | (36.4) | (11.7) | 569 | 1,599 | 20.9 | 37.9 | 1,323 | 2,474 | 6.4 | 21.4 | 2,325 | 1,201 | 20.4 | 37.7 | 998 | 2,753 | (14.8) | 30.5 | 3,232 |
| Loans and receivables | 4,328 | (8.9) | 26.4 | 4,753 | 12,512 | (2.9) | 10.8 | 12,883 | 9,666 | 5.2 | 20.1 | 9,185 | 10,203 | 5.7 | 20.9 | 9,655 | 12,798 | 12.4 | 72.3 | 11,385 |
| Loans and advances to customers | 3,786 | (10.0) | 24.9 | 4,208 | 11,253 | (5.9) | 7.4 | 11,958 | 9,520 | 6.4 | 21.4 | 8,947 | 9,861 | 5.2 | 20.3 | 9,377 | 10,412 | 7.4 | 64.6 | 9,693 |
| Loans and advances to credit institutions and others | 542 | (0.5) | 38.1 | 544 | 1,258 | 36.0 | 55.1 | 925 | 146 | (38.5) | (29.9) | 238 | 342 | 22.8 | 40.5 | 278 | 2,386 | 41.0 | 116.2 | 1,691 |
| Tangible assets | 152 | 39.2 | 93.2 | 109 | 86 | (8.4) | 4.5 | 94 | 121 | 2.6 | 17.1 | 118 | 212 | 4.3 | 19.3 | 203 | 335 | 8.9 | 66.9 | 307 |
| Other assets | 167 | (8.9) | 26.4 | 183 | 592 | 15.9 | 32.2 | 511 | 352 | 19.0 | 35.8 | 296 | 573 | 64.8 | 88.6 | 347 | 360 | (5.0) | 45.7 | 379 |
| Total assets/Liabilities and equity | 6,443 | (7.4) | 28.6 | 6,954 | 15,209 | 0.1 | 14.2 | 15,192 | 13,489 | 0.2 | 14.3 | 13,461 | 15,017 | 1.7 | 16.3 | 14,769 | 23,502 | 12.8 | 72.9 | 20,834 |
| Deposits from central banks and credit institutions | 35 | (56.6) | (39.8) | 80 | 1,924 | (27.5) | (17.3) | 2,654 | 436 | 7.9 | 23.1 | 404 | 1,728 | (21.7) | (10.4) | 2,206 | 246 | 10.4 | 69.3 | 223 |
| Deposits from customers | 4,860 | (7.9) | 27.8 | 5,280 | 7,977 | 1.9 | 16.3 | 7,829 | 10,506 | 2.4 | 16.9 | 10,256 | 9,331 | (0.0) | 14.4 | 9,335 | 19,774 | 13.3 | 73.7 | 17,449 |
| Debt certificates | 71 | (8.2) | 27.4 | 78 | 1,717 | 10.2 | 25.8 | 1,557 | 250 | (53.4) | (46.8) | 536 | 1,443 | 45.5 | 66.5 | 992 | - | - | - | - |
| Subordinated liabilities | - | - | - | - | 577 | (11) | 1 | 650 | 275 | 76 | 101 | 157 | 365 | 4 | 19 | 352 | - | - | - | - |
| Financial liabilities held for trading | 9 | - | - | - | 862 | 13 | 28 | 766 | 50 | (34) | (25) | 76 | 138 | 39 | 59 | 100 | 5 | - | - | - |
| Other liabilities | 1,097 | (5.0) | 31.8 | 1,155 | 1,637 | 32.1 | 50.7 | 1,240 | 1,128 | (4.7) | 8.7 | 1,184 | 1,524 | 15.6 | 32.3 | 1,319 | 2,690 | 12.2 | 71.9 | 2,399 |
| Economic capital allocated | 370 | 2.2 | 41.9 | 362 | 515 | 3.6 | 18.2 | 497 | 843 | (0.5) | 13.5 | 848 | 487 | 4.9 | 20.0 | 465 | 786 | 3.0 | 57.8 | 763 |
