

Highlights
- Economic recovery is consolidating.
- Excellent performance of the production of new loans and customer deposits.
- Earnings for the fourth quarter affected by the contributions to the DGF and to the national Resolution Fund.
- Reduction in the cost of risk.
- Sound risk indicators.
Business activity
(Year-on-year change. Data as of 31-12-2015)
Net interest income/ATA
(Percentage)
Operating income
(Million euros)
Net attributable profit
(Million euros)
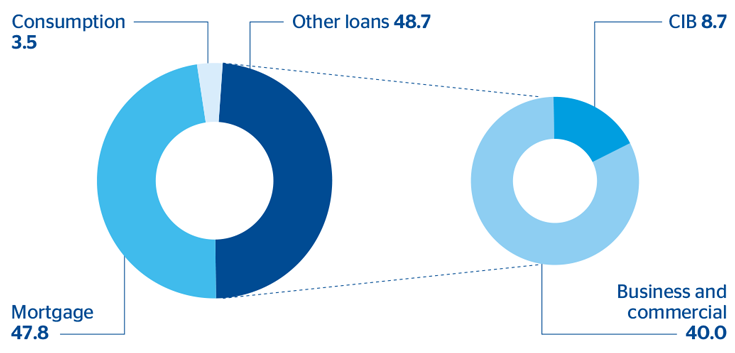
Breakdown of loans and advances to customers (gross)
(Percentage as of 31-12-2015)
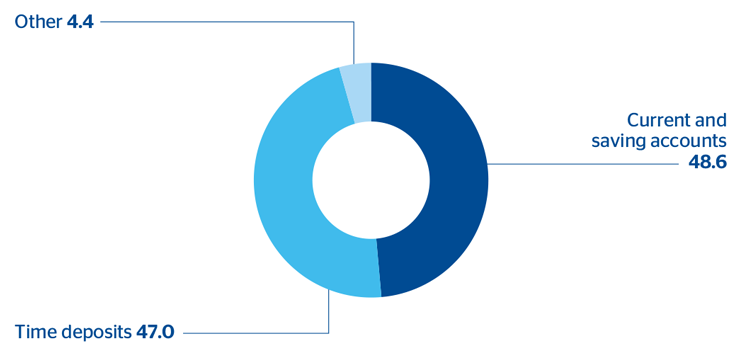
Breakdown of customer deposits under management
(Percentage as of 31-12-2015)
Financial statements and relevant business indicators
 Download Excel
|
|
Million euros and percentage | ||
|---|---|---|---|
| Income statement | 2015 | Δ% | 2014 |
| Net interest income | 4,000 | 4.4 | 3,830 |
| Net fees and commissions | 1,605 | 10.5 | 1,453 |
| Net trading income | 1,013 | (11.9) | 1,149 |
| Other income/expenses | 185 | (1.9) | 189 |
| Gross income | 6,804 | 2.8 | 6,621 |
| Operating expenses | (3,502) | 13.4 | (3,087) |
| Personnel expenses | (1,936) | 8.7 | (1,780) |
| General and administrative expenses | (1,186) | 19.2 | (995) |
| Depreciation and amortization | (381) | 22.1 | (312) |
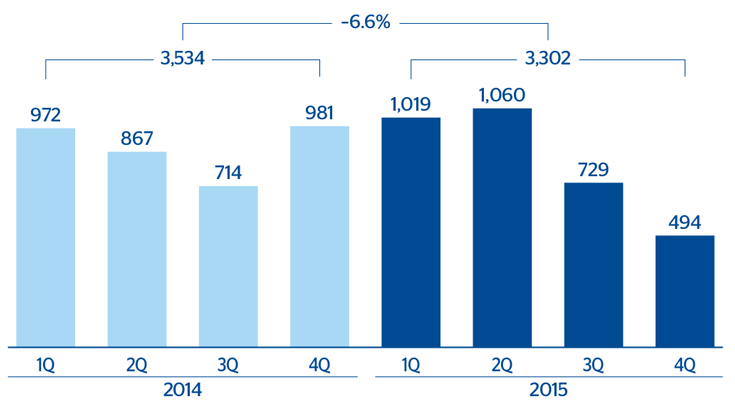
| Operating income | 3,302 | (6.6) | 3,534 |
| Impairment on financial assets (net) | (1,332) | (21.2) | (1,690) |
| Provisions (net) and other gains (losses) | (478) | (23.3) | (623) |
| Income before tax | 1,492 | 22.3 | 1,220 |
| Income tax | (440) | 22.6 | (359) |
| Net income | 1,052 | 22.1 | 862 |
| Non-controlling interests | (6) | 72.4 | (4) |
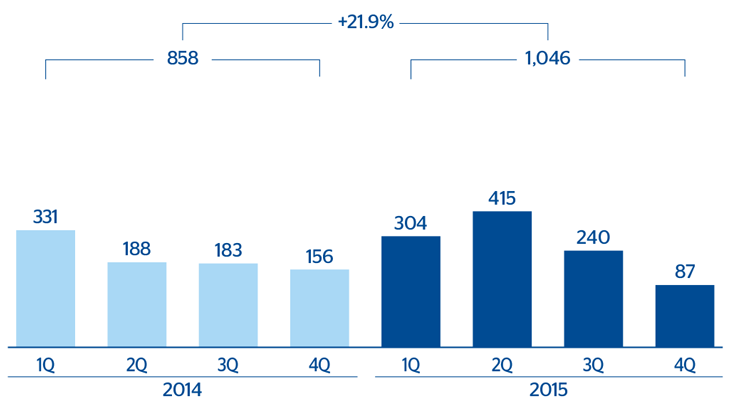
| Net attributable profit | 1,046 | 21.9 | 858 |
Download Excel
|
|
Million euros and percentage | ||
|---|---|---|---|
| Balance sheet | 31-12-15 | Δ% | 31-12-14 |
| Cash and balances with central banks | 8,670 | 10.1 | 7,876 |
| Financial assets | 117,631 | 1.4 | 116,016 |
| Loans and receivables | 209,745 | 9.7 | 191,278 |
| Loans and advances to customers | 184,115 | 8.8 | 169,216 |
| Loans and advances to credit institutions and other | 25,630 | 16.2 | 22,062 |
| Inter-area positions | 557 | - | - |
| Tangible assets | 702 | 0.3 | 700 |
| Other assets | 2,338 | (9.2) | 2,576 |
| Total assets/liabilities and equity | 339,643 | 6.7 | 318,446 |
| Deposits from central banks and credit institutions | 59,456 | (8.2) | 64,765 |
| Deposits from customers | 185,314 | 20.1 | 154,261 |
| Debt certificates | 41,422 | (0.6) | 41,689 |
| Subordinated liabilities | 2,360 | 10.9 | 2,128 |
| Inter-area positions | - | - | 45 |
| Financial liabilities held for trading | 39,955 | (9.1) | 43,977 |
| Other liabilities | 1,879 | (45.1) | 3,422 |
| Economic capital allocated | 9,259 | 13.5 | 8,158 |
Download Excel
|
|
Million euros and percentage | ||
|---|---|---|---|
| Relevant business indicators | 31-12-15 | Δ% | 31-12-14 |
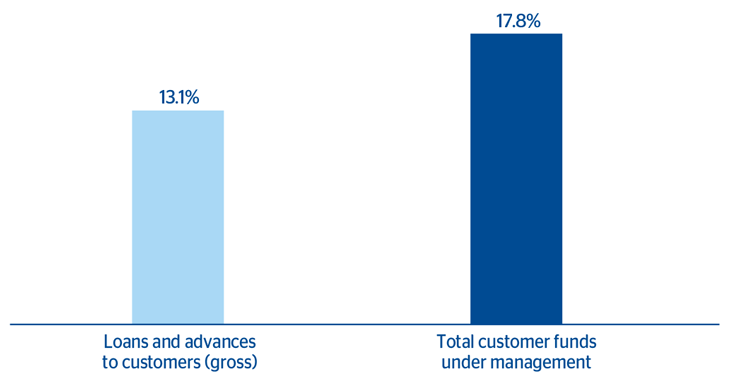
| Loans and advances to customers (gross) (1) | 187,719 | 13.1 | 165,975 |
| Customer deposits under management (1) | 166,869 | 20.8 | 138,140 |
| Off-balance sheet funds (2) | 56,690 | 9.6 | 51,702 |
| Efficiency ratio (%) | 51.5 |
|
46.6 |
| NPL ratio (%) | 6.6 |
|
6.0 |
| NPL coverage ratio (%) | 59 |
|
45 |
| Cost of risk (%) | 0.71 |
|
0.95 |
Macro and industry trends
The Spanish economy continues to grow at the rates seen in the first half of 2015 (quarterly growth of GDP is around 0.8%). This positive trend is supported mainly by strong domestic demand.
In the financial sector, the volume of non-performing loans continues to fall (the NPL ratio stood at 10.35% in November, its lowest level since July 2012), Spanish banks still find it easy to obtain liquidity on the financial markets and the sector remains solvent. At the same time, the deleveraging process is moderating (the year-on-year fall in the stock of loans as of November 2015 was 3.2%), as the flow of new lending is speeding up (up 8.9% year-on-year at November).
Activity
Growth in gross lending to customers of 13.1% in year-on-year terms was influenced by the inclusion of CX since April 24, 2015. Without the inclusion, the balance of lending was practically flat over the year (–0.2%). Loan production performed particularly well in 2015 (not considering the balances of CX), with year-on-year growth of 34.2% in mortgages, 30.7% in consumer finance and 24.3% in small businesses. As a result, the back-book of these products, except for mortgages (as this is a portfolio with long maturities), has posted positive year-on-year growth.
With respect to asset quality, the incorporation of CX has led to an increase in non-performing loans, and as a result a rise in the NPL ratio, but also an increased coverage ratio. On a comparable basis, it’s worth of note the containment of NPL net entries. As a result, the NPL ratio improved by 23 basis points over the year. Over the quarter, the NPL ratio declined by 11 basis points. The coverage ratio increased by 14.8 percentage points over the year (–60 basis points without CX) and declined slightly over the quarter (98 basis points).
Customer deposits under management grew significantly in 2015 (up 20.8% year-on-year). The inclusion of CX has a major influence on this trend, although there was also a moderate growth (up 2.2%) if the balances from CX are not included, due to the good performance of current and savings accounts (up 18.9% not including CX; up 31.9% including CX) and a containment of the decline in time deposits, reversing the trend of previous quarters (down 12.5% year-on-year not including CX, –0.2% over the quarter; including CX there was a year-on-year growth of 11.2%). Off-balance-sheet funds grew by 9.6%, despite the unfavorable performance of the markets in the final months of 2015 (growth of 3.2% over the quarter).
Earnings
As mentioned above, the area’s income statement is affected by the reclassification of some of the operating expenses related to Technology from the Corporate Area to the Banking Activity area in Spain. To ensure comparable figures, the income statements of 2015 and 2014 have been modified. The most important points in the year-on-year comparison are summed up below:
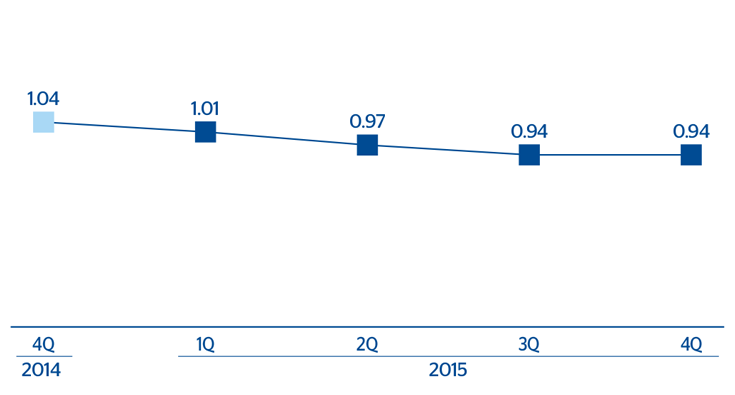
- In an environment of all-time low interest rates, net interest income has grown by 4.4% on the figure for 2014. The lower yield on loans is being offset by cheaper funding, both retail (reduction in the cost of deposits) and wholesale.
- Good performance of income from fees and commissions (up 10.5% in year-on-year terms), despite the regulatory limitations currently in place with respect to cards and pension fund management. This positive performance springs from a number of factors: the good trend in funds, both in terms of volume managed and their mix; plans to improve the revenue heading that are being carried out; and the increase in advisory operations being executed in the wholesale businesses.
- The contribution from NTI is smaller than in 2014, due mainly to lower ALCO portfolio sales, despite the favorable performance in the Global Markets business in Spain.
- Booking in the fourth quarter of the contribution to the Deposit Guarantee Fund (FGD), and for the first time, to the national Resolution Fund, which explains the decline of 1.9% in the other income/expenses heading despite the good performance of the insurance business.
- Growth of 13.4% in operating expenses as a result of the inclusion of CX and of related integration costs.
- The continued improvement in asset quality has led to lower impairment losses on financial assets. The 2015 figure is down 21.2%, so the cumulative cost of risk as of December stands at 0.71%, an improvement on the first nine months of 2015 and on 2014.
- Provisions (net) and other gains/losses include the costs derived from the transformation process, as mentioned in previous quarterly reports. The cumulative figure for 2015 under this heading shows a reduction of 23.3% on the figure for 2014.
As a result, the net attributable profit generated by banking activity in Spain in 2015 was €1,046m, a year-on-year increase of 21.9%.