

Highlights
- Moderation in lending growth, focused on profitability.
- Superior performance of net interest income.
- Cost control.
- Risk indicators continue at very low levels.
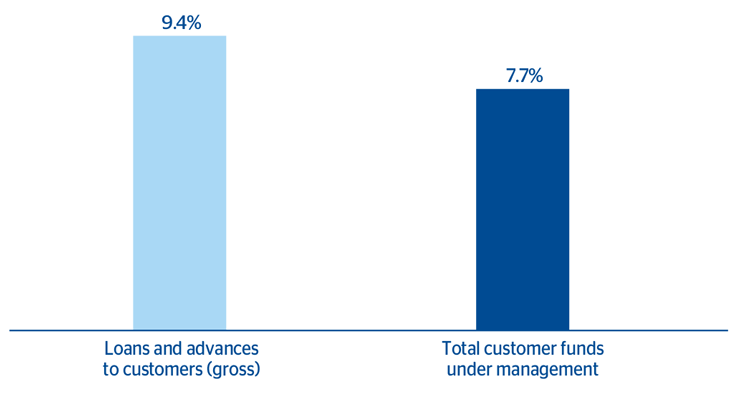
Business activity
(Year-on-year change at constant exchange rate. Data as of 31-12-2015)
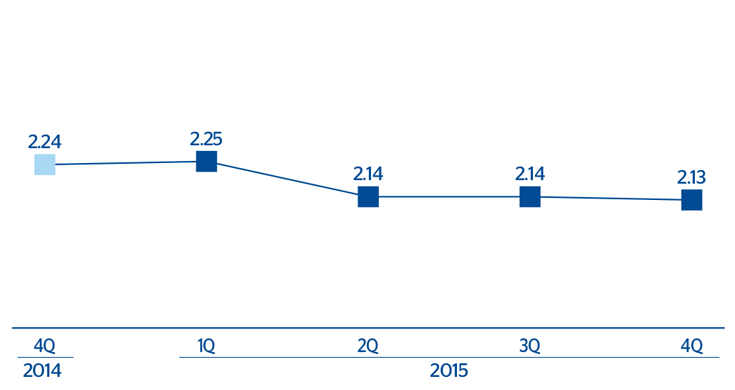
Net interest income/ATA
(Percentage. Constant exchange rate)
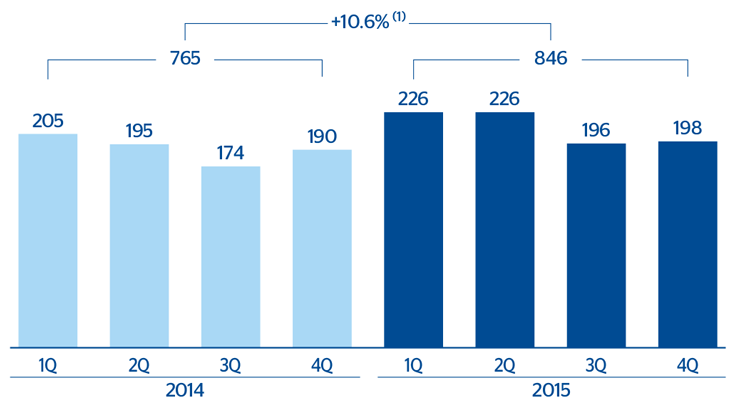
Operating income
(Million euros at constant exchange rate)
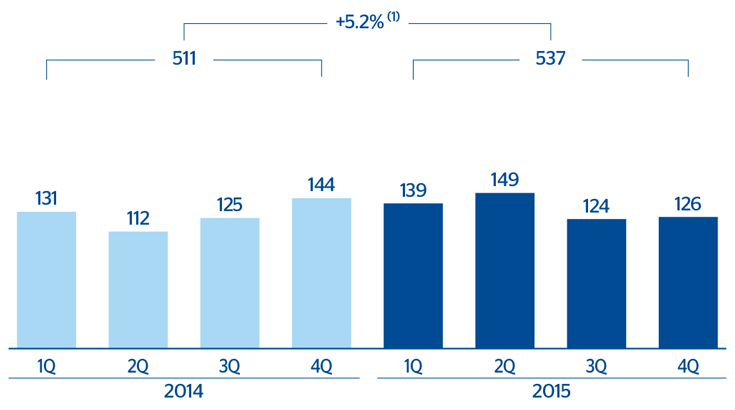
Net attributable profit
(Million euros at constant exchange rate)
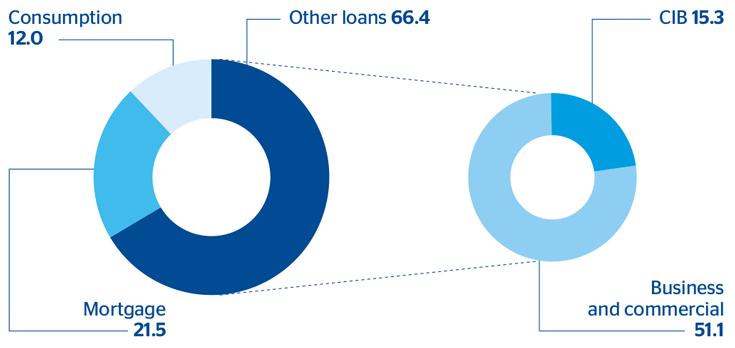
Breakdown of loans and advances to customers (gross) excluding repos
(Percentage as of 31-12-2015)
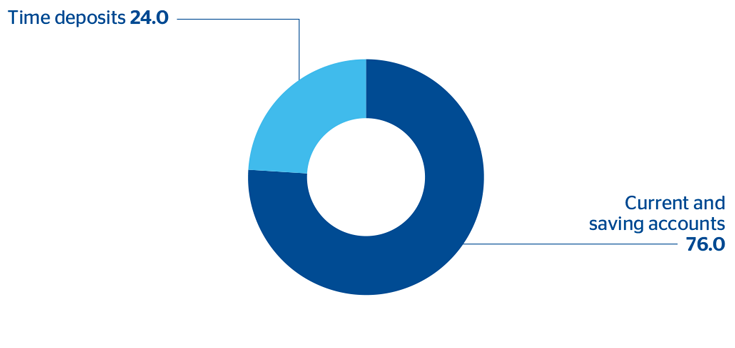
Breakdown of customer deposits under management
(Percentage as of 31-12-2015)
Financial statements and relevant business indicators
 Download Excel
|
|
|
Million euros and percentage | ||
|---|---|---|---|---|
| Income statement | 2015 | Δ% | Δ% (1) | 2014 |
| Net interest income | 1,811 | 25.5 | 4.9 | 1,443 |
| Net fees and commissions | 616 | 11.2 | (6.9) | 553 |
| Net trading income | 207 | 43.0 | 21.0 | 145 |
| Other income/expenses | 18 | n.s. | n.m. | (4) |
| Gross income | 2,652 | 24.1 | 3.8 | 2,137 |
| Operating expenses | (1,806) | 20.6 | 1.0 | (1,497) |
| Personnel expenses | (1,039) | 20.6 | 1.0 | (861) |
| General and administrative expenses | (564) | 23.2 | 3.2 | (457) |
| Depreciation and amortization | (204) | 13.9 | (4.8) | (179) |
| Operating income | 846 | 32.2 | 10.6 | 640 |
| Impairment on financial assets (net) | (142) | 107.5 | 72.6 | (68) |
| Provisions (net) and other gains (losses) | 1 | n.s. | n.m. | (10) |
| Income before tax | 705 | 25.7 | 5.2 | 561 |
| Income tax | (168) | 26.4 | 5.4 | (133) |
| Net incomes | 537 | 25.4 | 5.2 | 428 |
| Non-controlling interests | (0) | 25.0 | 4.4 | - |
| Net attributable profit | 537 | 25.4 | 5.2 | 428 |
Download Excel
|
|
|
Million euros and percentage | ||
|---|---|---|---|---|
| Balance sheet | 31-12-15 | Δ% | Δ% (1) | 31-12-14 |
| Cash and balances with central banks | 6,859 | 80.1 | 61.5 | 3,808 |
| Financial assets | 14,468 | 21.7 | 9.1 | 11,892 |
| Loans and receivables | 61,890 | 21.4 | 8.9 | 50,970 |
| Loans and advances to customers | 59,796 | 22.1 | 9.5 | 48,976 |
| Loans and advances to credit institutions and other | 2,094 | 5.0 | (5.8) | 1,994 |
| Inter-area positions | - | - | - | - |
| Tangible assets | 780 | 7.6 | (3.5) | 725 |
| Other assets | 2,457 | 31.7 | 18.1 | 1,866 |
| Total assets/liabilities and equity | 86,454 | 24.8 | 11.9 | 69,261 |
| Deposits from central banks and credit institutions | 6,100 | 5.8 | (5.1) | 5,765 |
| Deposits from customers | 63,715 | 24.0 | 11.2 | 51,394 |
| Debt certificates | 921 | 12.1 | 0.5 | 822 |
| Subordinated liabilities | 1,459 | 96.7 | 76.4 | 742 |
| Inter-area positions | 1,508 | n.m. | 292.3 | 345 |
| Financial liabilities held for trading | 3,844 | 64.2 | 47.2 | 2,341 |
| Other liabilities | 5,739 | 8.3 | (2.9) | 5,300 |
| Economic capital allocated | 3,167 | 24.1 | 11.3 | 2,552 |
Download Excel
|
|
|
Million euros and percentage | ||
|---|---|---|---|---|
| Relevant business indicators | 31-12-15 | Δ% | Δ% (1) | 31-12-14 |
| Loans and advances to customers (gross) (2) | 60,599 | 22.0 | 9.4 | 49,667 |
| Customer deposits under management (2) | 60,173 | 20.1 | 7.7 | 50,093 |
| Off-balance sheet funds (3) | - | - | - | - |
| Efficiency ratio (%) | 68.1 |
|
|
70.1 |
| NPL ratio (%) | 0.9 |
|
|
0.9 |
| NPL coverage ratio (%) | 151 |
|
|
167 |
| Cost of risk (%) | 0.25 |
|
|
0.16 |
Macro and industry trends
Economic growth in the United States, which is estimated at 2.5% for 2015, continues to be supported by the recovery of private consumption, in a context of sustained gains in employment (the unemployment rate at the end of 2015 stands at 5%) and low inflation (the year-on-year rate of change of inflation in December 2015 is 0.7%). With this improvement in the disposable income of households, the appreciation of the dollar, in a difficult external setting, is holding back manufacturing activity and exports, while the fall in oil prices is reducing investment in the energy sector. In view of the absence of inflationary pressures, the Federal Reserve has opted to implement a cycle of interest rate hikes which, however, will be much more gradual than the one seen in other phases of monetary tightening, given the recent deterioration of the international economic situation. On December 16 it approved an increase of 25 basis points in the interest rate, the first since June 2006.
With respect to the exchange rate, the divergence between the monetary-policy approach of the United States and the Eurozone (approval of new ECB stimulus package), together with the difference in growth, currently favorable for the United States, have led to the euro losing 11.5% against the dollar in year-end exchange rates and 19.7% in average rates.
The financial sector continues in good shape, despite the environment of low interest rates and a slight increase in loan-loss provisions. Lending in 2015 grew in year-on-year terms at 7.6%, led by better performance of loans to the commercial real-estate sector: +10%. On the liabilities side, there has been a reduction in the weighting of time deposits due to low interest rates.
Activity
All the comments relating to rates of change in activity or earnings for the area refer to constant exchange rates, unless expressly stated otherwise.
On the lending side, the rate of growth moderated over 2015, particularly in the second half of the year, to a year-on-year rate of 9.4% at the close of December. This is due to the strategic decision taken in the area to focus on more profitable operations. As a result, customer spreads have remained stable.
Asset quality indicators are still at minimum levels for the cycle, with an NPL ratio of 0.9% and a coverage ratio of 151%.
Customer deposits under management at the end of 2015 remain practically at the same year-on-year growth level as in the first nine months of the year (up 7.7%). BBVA Compass continues to strengthen its position in the Sun Belt, growing faster than its peers and gaining market share in deposits in all the states where it operates, according to the latest data published by the Federal Deposit Insurance Corporation. By products, current and savings accounts have increased by 5.5% since the close of 2014 and time deposits by 15.4%
Earnings
The area ended 2015 with a net attributable profit of €537m, an increase of 5.2% on 2014. Of this total, €126m corresponds to the last quarter of the year.
The main features of the income statement over 2015 have been:
- Outstanding net interest income, which increased its contribution to the income statement every quarter in 2015, offsetting the more sluggish performance of income from fees and commissions. This has been possible thanks to the positive performance of business activity and the maintenance of spreads in the area.
- Very good performance of NTI resulting from the capital gains from the sale of ALCO portfolios and the good performance of the Global Markets unit over the period.
- Operating costs kept in check, with a rise of only 1.0% in the last 12 months.
- Lastly, an increase in impairment losses on financial assets. Despite this, the cumulative cost of risk through December 2015 continues to be very low, at 0.25%.