

In 2015, global economic growth lost momentum, mainly as a result of the slowdown in the main emerging economies. The recovery in the developed markets has been insufficient to offset this impact. The new downward correction of activity in China, the tightening of monetary policy in the United States and the fall in the price of commodities have resulted in a difficult scenario that has kept global growth in 2015 at around 3.2%.
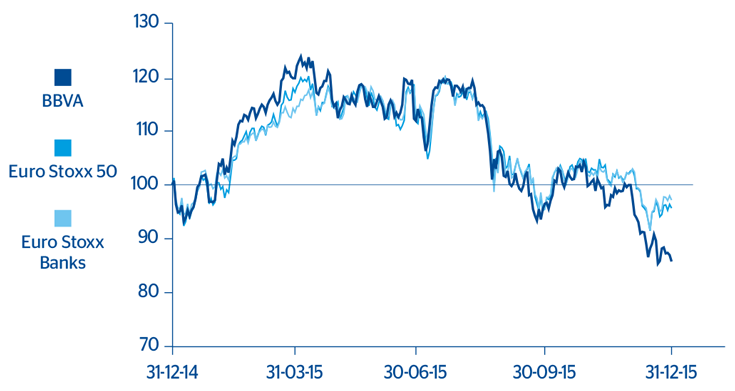
In this global situation, the main stock-market indices, except for the European Stoxx 50, have closed 2015 at levels lower than those registered the previous year. In the United States, the general S&P 500 index closed with a year-on-year decline of 0.7%, while in Spain the Ibex 35 lost 7.2%, after the consecutive rises registered in the two previous years. In contrast, in Europe, the Stoxx 50 index gained 3.2%.
The performance of the banking sector in 2015 has to a certain extent proved a burden on these general indices. The S&P Regional Banks banking sector index in the United States closed 2015 with a year-on-year decline of 0.3%, while in Europe, the Stoxx Banks fell 3.3% and the Euro Stoxx Banks, which includes the banks in the Eurozone, lost 4.9%. The sector’s performance over the year has been affected by a number of factors, including market uncertainty about the potential impact of the regulatory changes currently being discussed and the downward revision of the expectations of growth over the year.
The price of the BBVA share increased by 19.8% in the first quarter of 2015 before starting a downward path that continued for the rest of the year. At the close of the year, the price posted a year-on-year decline of 14.2%, with a price of €6.74 per share as of 31-Dec-2015. This amount represents a market capitalization of €42,905m, a price/book value ratio of 0.9 and a P/E of 13.2 (calculated on BBVA Group’s net attributable profit for 2015). At these levels, the value of the BBVA share compares favorably with the average for European banks.
BBVA share evolution compared with European indices
(Base indice 100=31-12-2014)
 Download Excel
| La acción BBVA y ratios bursátiles | 2015 | 2014 |
|---|---|---|
| Number of shareholders | 934,244 | 960,397 |
| Number of shares issued | 6,366,680,118 | 6,171,338,995 |
| Daily average number of shares traded | 46,641,017 | 48,760,861 |
| Daily average trading (million euros) | 393 | 437 |
| Maximum price (euros) | 9.77 | 9.99 |
| Minimum price (euros) | 6.70 | 7.45 |
| Closing price (euros) | 6.74 | 7.85 |
| Book value per share (euros) (1) | 7.47 | 8.01 |
| Market capitalization (million euros) | 42,905 | 48,470 |
| Price/book value (times) | 0.9 | 1.0 |
| PER (Price/earnings; times) | 13.2 | 17.3 |
| Yield (Dividend/price; %) (2) | 5.5 | 4.2 |
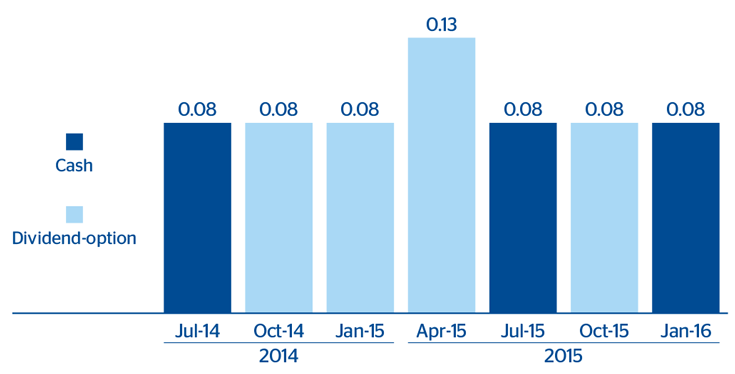
As regards shareholder remuneration, two dividends were paid out in cash at €0.08 gross per share each, amounting to disbursements of €504.4m on July 16, 2015 and €509.3m on January 12, 2016, against 2015 earnings. Additionally, at its meetings held on March 25 and September 30, 2015, the Board of Directors of BBVA agreed to complete two capital increases against reserves, under the terms agreed by the Annual General Meeting of Shareholders held on March 13, 2015. These increases have served as instruments for developing the share remuneration scheme called “dividend-option”, details of which have been widely reported in previous reports. In the case of the implementation of the first “dividend-option”, the holders of 90.31% of these rights chose to receive new shares. In the case of the second, the holders of 89.65% decided to receive new shares. The acceptance percentages are the highest obtained in the last two years, confirming the excellent level of support for this remuneration system among shareholders.
Shareholder remuneration
(Euros -gross-/share)
The number of BBVA shares, as of 31-Dec-2015 stood at 6,367 million. Their increase on the figure at the end of 2014 is explained by the capital increases against reserves completed over the year to execute the aforementioned “dividend-option”.
The number of BBVA shareholders as of 31-Dec-2015 stood at 934,244, a year-on-year decline of 2.7%. The granularity of the shareholders remained at similar levels in 2015, with no significant holdings. Investors resident in Spain hold 44.7% of the share capital, while the percentage owned by non-resident shareholders has continued to increase to 55.3% (compared with 53.9% in 2014).
BBVA shares are traded on the Continuous Market of the Spanish Stock Exchanges and also on the stock markets in London and Mexico. BBVA American depositary shares (ADS) are traded in New York and also on the Lima Stock Exchange (Peru) under an exchange agreement between these two markets.
Lastly, BBVA shares are included in the key Ibex 35 and Euro Stoxx 50 indices, with an 8.82% weighting in the former and 2.02% in the latter, as well as in several banking industry indices, most notably Stoxx Banks, with a weighting of 4.31%, and the Euro Stoxx Banks, with a weighting of 8.96%. In addition, BBVA maintains a significant presence on the main sustainability indices or ESG (Environmental, Social and Governance) indices, which evaluate the performance of companies in this area. In 2015, BBVA maintained its place in the main sustainability indices at international level.
Download Excel
| Shareholder structure (31-12-2015) |
Shareholders | Shares | ||
|---|---|---|---|---|
| Number of shares | Number | % | Number | % |
| Up to 150 | 217,876 | 23.3 | 15,490,716 | 0.2 |
| 151 to 450 | 196,590 | 21.0 | 53,455,140 | 0.8 |
| 451 to 1800 | 282,378 | 30.2 | 265,401,936 | 4.2 |
| 1,801 to 4,500 | 124,071 | 13.3 | 353,693,692 | 5.6 |
| 4,501 to 9,000 | 57,993 | 6.2 | 364,537,906 | 5.7 |
| 9,001 to 45,000 | 48,866 | 5.2 | 851,284,685 | 13.4 |
| More than 45,001 | 6,470 | 0.7 | 4,462,816,043 | 70.1 |
| Total | 934,244 | 100.0 | 6,366,680,118 | 100.0 |
Download Excel
|
|
|
|
|---|---|---|
| Main sustainability indices with BBVA presence (31-12-2015) |
|
Weighting (%) |

|
DJSI World | 0.57 |
| DJSI Europe | 1.24 | |
| DJSI Eurozone | 2.60 | |

(1) |
MSCI World ESG | 0.29 |
| MSCI EX USA ESG | 0.69 | |
| MSCI AC Europe ESG | 1.13 | |

|
FTSE4Good Global | 0.27 |
| FTSE4Good Global 100 | 0.47 | |
| FTSE4Good Europe | 0.74 | |
| FTSE4Good Europe 50 | 1.34 | |

|
Euronext-Vigeo Europe 120 | 0.79 |
| Euronext-Vigeo Eurozone 120 | 0.76 | |
|
STOXX Global ESG Environmental Leaders |
0.42 |
| STOXX Global ESG Social Leaders | 0.42 | |
| EURO STOXX ESG Leaders 50 | 2.00 | |
| STOXX Europe ESG Leaders 50 | 2.00 | |
| STOXX Global ESG Leaders | 0.28 |