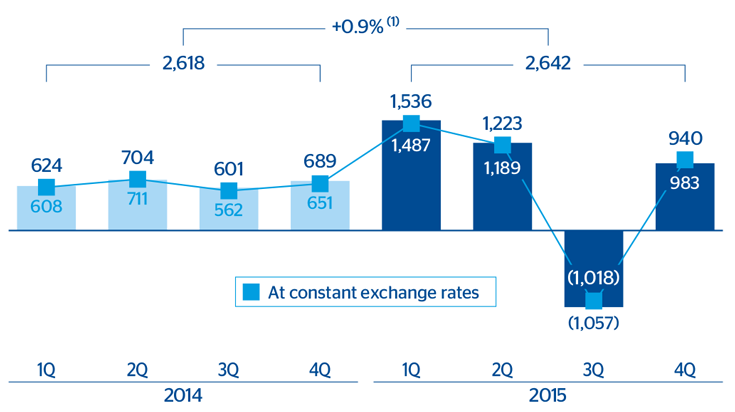
BBVA Group generated a net attributable profit of €2,642m in 2015. These earnings incorporate those generated by CX since April 24, and the effects of the purchase of an additional 14.89% stake in Garanti since the third quarter, with its resulting incorporation by the full consolidation method and the valuation at fair value of the 25.01% that it already owned.
Gross income
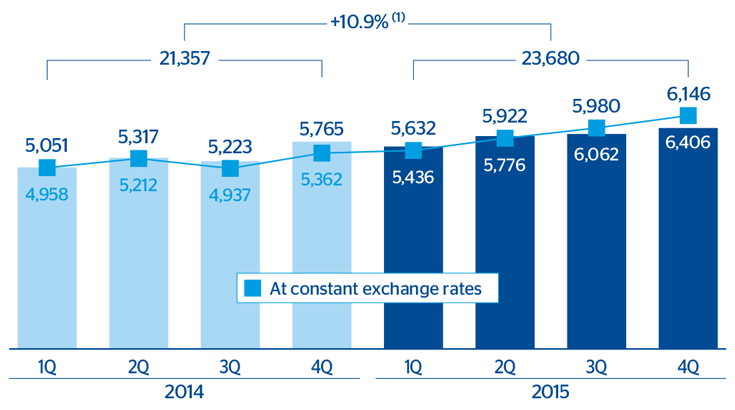
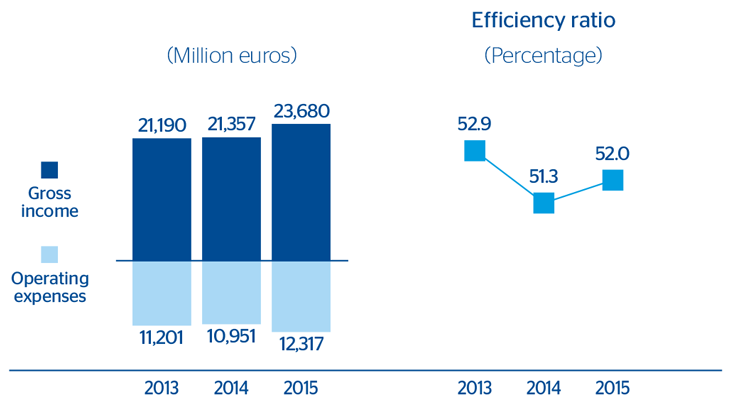
The Group’s gross income was €23,680m, 10.9% higher than in 2014 (up 15.7% at constant exchange rates). This amount was achieved thanks to:
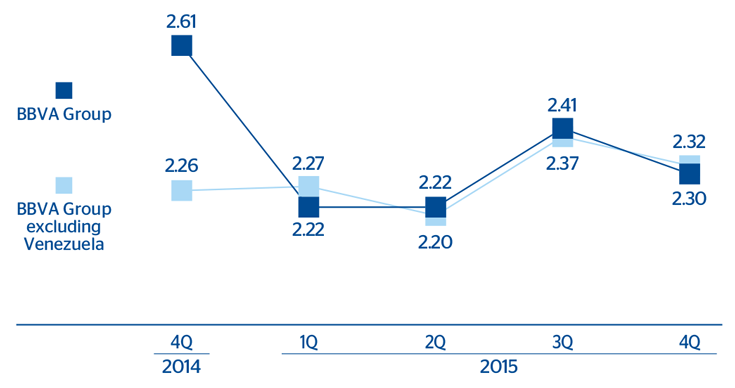
- Good performance of net interest income (up 8.7% year-on-year, 21.5% at constant exchange rates). Including the stake in Turkey on an on-going basis (at 25.01% and integrated proportionally to this stake), this heading closed the year at a similar level to 2014. However, at constant exchange rates it increased by 11.5%. This trend is explained by: the increased activity in emerging countries and the United States, the good performance of loan production in Spain, the incorporation of balances from CX, as well as the cheaper cost of deposits in Spain and the defense of customer spreads in the rest of the geographical areas.
Gross income
(Million euros)
 Download Excel
|
|
Million euros | |||||||
|---|---|---|---|---|---|---|---|---|
|
|
2015 | 2014 | ||||||
| Consolidated income statement: quarterly evolution (1) | 4Q | 3Q | 2Q | 1Q | 4Q | 3Q | 2Q | 1Q |
| Net interest income | 4,415 | 4,490 | 3,858 | 3,663 | 4,248 | 3,830 | 3,647 | 3,391 |
| Net fees and commissions | 1,263 | 1,225 | 1,140 | 1,077 | 1,168 | 1,111 | 1,101 | 985 |
| Net trading income | 451 | 133 | 650 | 775 | 514 | 444 | 426 | 751 |
| Dividend income | 127 | 52 | 194 | 42 | 119 | 42 | 342 | 29 |
| Income by the equity method | (16) | 3 | 18 | 3 | 3 | 31 | 16 | (14) |
| Other operating income and expenses | (94) | 76 | 62 | 73 | (287) | (234) | (215) | (90) |
| Gross income | 6,146 | 5,980 | 5,922 | 5,632 | 5,765 | 5,223 | 5,317 | 5,051 |
| Operating expenses | (3,292) | (3,307) | (2,942) | (2,776) | (2,905) | (2,770) | (2,662) | (2,613) |
| Personnel expenses | (1,685) | (1,695) | (1,538) | (1,460) | (1,438) | (1,438) | (1,359) | (1,375) |
| General and administrative expenses | (1,268) | (1,252) | (1,106) | (1,024) | (1,147) | (1,037) | (1,017) | (959) |
| Depreciation and amortization | (340) | (360) | (299) | (291) | (320) | (296) | (286) | (279) |
| Operating income | 2,853 | 2,673 | 2,980 | 2,857 | 2,860 | 2,453 | 2,655 | 2,438 |
| Impairment on financial assets (net) | (1,057) | (1,074) | (1,089) | (1,119) | (1,168) | (1,142) | (1,073) | (1,103) |
| Provisions (net) | (157) | (182) | (164) | (230) | (513) | (199) | (298) | (144) |
| Other gains (losses) | (97) | (127) | (123) | (66) | (201) | (136) | (191) | (173) |
| Income before tax | 1,544 | 1,289 | 1,604 | 1,442 | 978 | 976 | 1,092 | 1,017 |
| Income tax | (332) | (294) | (429) | (386) | (173) | (243) | (292) | (273) |
| Net income from ongoing operations | 1,212 | 995 | 1,175 | 1,056 | 805 | 733 | 800 | 744 |
| Results from corporate operations (2) | 4 | (1,840) | 144 | 583 | - | - | - | - |
| Net income | 1,215 | (845) | 1,319 | 1,639 | 805 | 733 | 800 | 744 |
| Non-controlling interests | (275) | (212) | (97) | (103) | (116) | (132) | (95) | (120) |
| Net attributable profit | 940 | (1,057) | 1,223 | 1,536 | 689 | 601 | 704 | 624 |
| Net attributable profit from ongoing operations (3) | 936 | 784 | 1,078 | 953 | 689 | 601 | 704 | 624 |
| Basic earnings per share (euros) (4) | 0.14 | (0.18) | 0.18 | 0.24 | 0.10 | 0.09 | 0.11 | 0.10 |
 Download Excel
|
|
Million euros | |||
|---|---|---|---|---|
| Consolidated income statement (1) | 2015 | Δ% | Δ% at constant exchange rates | 2014 |
| Net interest income | 16,426 | 8.7 | 21.5 | 15,116 |
| Net fees and commissions | 4,705 | 7.8 | 12.1 | 4,365 |
| Net trading income | 2,009 | (5.9) | (2.6) | 2,135 |
| Dividend income | 415 | (21.8) | (22.4) | 531 |
| Income by the equity method | 8 | (77.2) | (78.9) | 35 |
| Other operating income and expenses | 117 | n.m. | 2.7 | (826) |
| Gross income | 23,680 | 10.9 | 15.7 | 21,357 |
| Operating expenses | (12,317) | 12.5 | 15.8 | (10,951) |
| Personnel expenses | (6,377) | 13.7 | 14.7 | (5,609) |
| General and administrative expenses | (4,650) | 11.7 | 17.6 | (4,161) |
| Depreciation and amortization | (1,290) | 9.3 | 14.7 | (1,180) |
| Operating income | 11,363 | 9.2 | 15.6 | 10,406 |
| Impairment on financial assets (net) | (4,339) | (3.3) | 1.6 | (4,486) |
| Provisions (net) | (733) | (36.6) | (30.9) | (1,155) |
| Other gains (losses) | (412) | (41.2) | (41.3) | (701) |
| Income before tax | 5,879 | 44.7 | 54.9 | 4,063 |
| Income tax | (1,441) | 46.9 | 58.5 | (981) |
| Net income from ongoing operations | 4,438 | 44.0 | 53.8 | 3,082 |
| Results from corporate operations (2) | (1,109) | n.m. | n.m. | - |
| Net income | 3,328 | 8.0 | 15.3 | 3,082 |
| Non-controlling interests | (686) | 48.0 | 93.9 | (464) |
| Net attributable profit | 2,642 | 0.9 | 4.4 | 2,618 |
| Net attributable profit from ongoing operations (3) | 3,752 | 43.3 | 48.2 | 2,618 |
| Basic earnings per share (euros) (4) | 0.39 |
|
|
0.41 |
- Excellent performance of income from fees and commissions, which has gained momentum over the year. The negative effect of regulatory limits continues to be offset by an increasingly diversified revenue base. This is thanks to the improvement plans being carried out in a number of geographical areas (mainly in Spain and Turkey), the aforementioned increase in activity and an increase in higher added-value operations being delivered by the Group’s wholesale businesses.
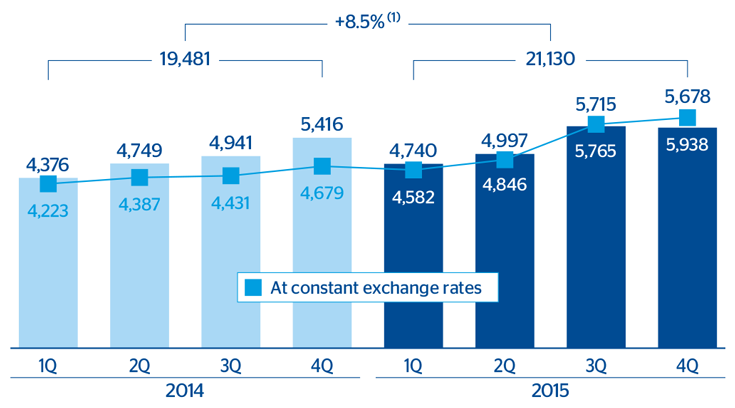
- As a result, more recurring revenue (net interest income plus fees and commissions) is still an extremely relevant element of the income statement, with an increase of 8.5% (up 19.2% at constant exchange rates). With Turkey presented on an on-going basis and taking into account the effect of exchange rates, the figure shows a high resilience (up 0.1%). Moreover, at constant exchange rates there was an increase of 10.1%.
Net interest income/ATA
(Percentage)
Net interest income plus fees and commissions
(Million euros)
- NTI performed very well in the fourth quarter compared to the third, thanks to the sale of ALCO portfolios in the United States and the positive trend in South America. Market turbulence, particularly starting in the third quarter of 2015 (basically due to uncertainty with respect to growth in China and the fall in oil prices), has led to the cumulative figure for the year declining by 5.9% (down 2.6% at constant exchange rates). With Turkey considered on an on-going basis, this heading increased by 3.0% (up 6.6% excluding the currency effect), even though the comparison basis of 2014 was high.
- The dividends heading includes mainly those from the Group’s stake in Telefónica (second and fourth quarters) and China Citic Bank (CNCB). In 2015 the figure fell by 21.8% due to the lack of a dividend payment from CNCB.
- Income by the equity method barely amounted to €8m. In 2014, this heading basically included income from the Group’s stake in the Chinese entity CIFH until the month of November.
- Lastly, other operating income and expenses for the fourth quarter includes the one-off contribution to the Spanish DGF, which in 2014 was paid over four quarters, and for the first time, a payment to the national Resolution Fund. In the cumulative total for the year, the good performance of income from insurance activities has offset the contributions to different guarantee funds in the countries where BBVA operates.
Operating income
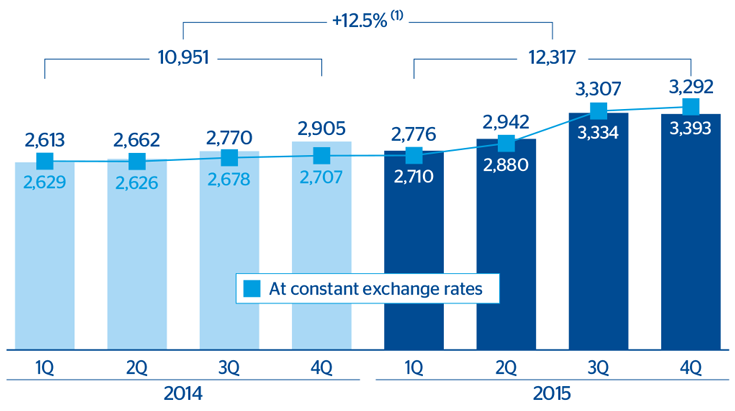
Operating expenses increased by 12.5% on 2014 (up 15.8% at constant exchange rates). With figures from Turkey presented on an on-going basis, the year-on-year increase is reduced to 6.0% (9.1% at constant exchange rates), affected by the high inflation in some emerging countries. Banking Activity in Spain includes CX since April 24 and the related integration costs. Excluding the incorporation of CX, the rate of increase of expenses is still lower than that of gross income.
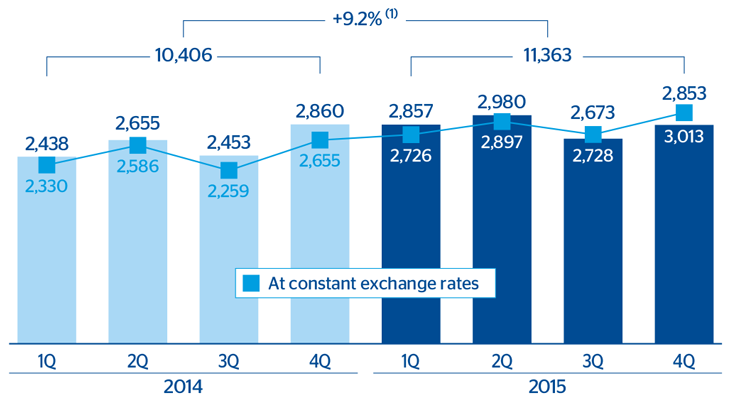
As a result, operating income has improved to €11,363m, up 9.2% on 2014 (up 15.6% at constant exchange rates, 2.0% with data from Turkey presented on an on-going basis, and 8.0% with data from Turkey presented on an on-going basis and at constant exchange rates).
Operating expenses
(Million euros)
 Download Excel
|
|
Million euros | ||
|---|---|---|---|
| Breakdown of operating expenses and efficiency calculation | 2015 | Δ% | 2014 |
| Personnel expenses | 6,377 | 13.7 | 5,609 |
| Wages and salaries | 5,047 | 18.2 | 4,268 |
| Employee welfare expenses | 827 | 0.1 | 826 |
| Training expenses and other | 504 | (2.1) | 515 |
| General and administrative expenses | 4,650 | 11.7 | 4,161 |
| Premises | 1,054 | 9.5 | 963 |
| IT | 880 | 6.0 | 831 |
| Communications | 289 | 0.4 | 288 |
| Advertising and publicity | 393 | 13.4 | 346 |
| Corporate expenses | 114 | 10.5 | 103 |
| Other expenses | 1,444 | 21.0 | 1,194 |
| Levies and taxes | 476 | 8.8 | 437 |
| Administration expenses | 11,027 | 12.9 | 9,771 |
| Depreciation and amortization | 1,290 | 9.3 | 1,180 |
| Operating expenses | 12,317 | 12.5 | 10,951 |
| Gross income | 23,680 | 10.9 | 21,357 |
| Efficiency ratio (Operating expenses/gross income, in %) | 52.0 |
|
51.3 |
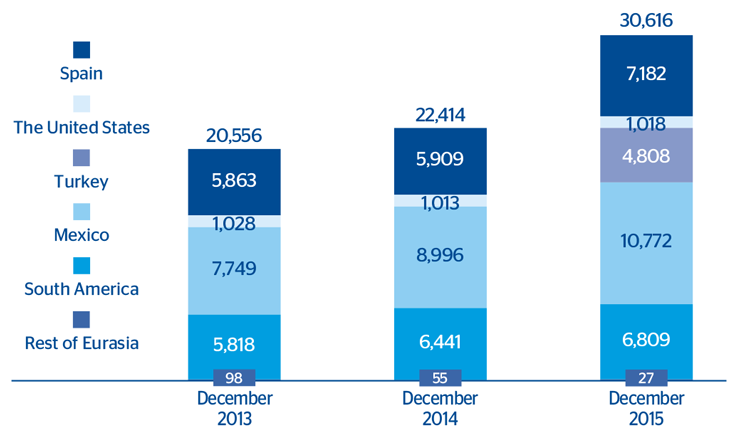
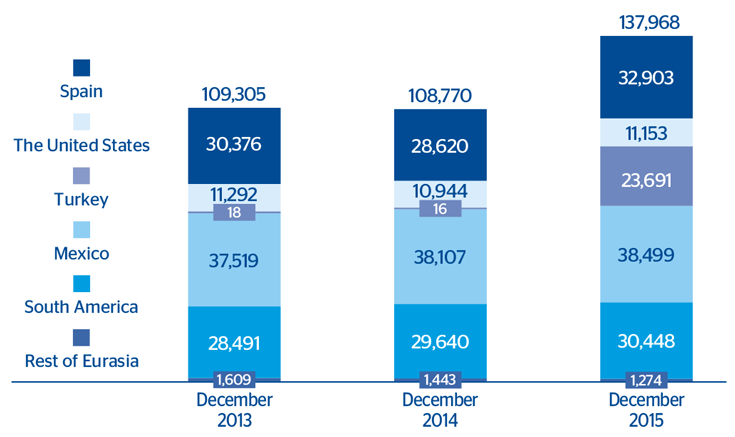
Number of branches (1)
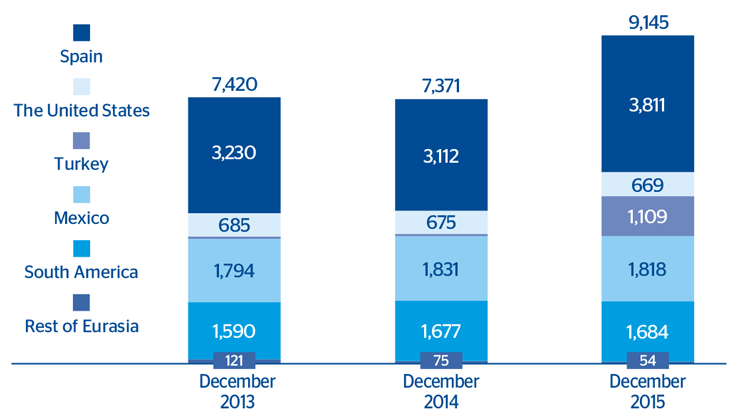
Efficiency
Number of ATMs (1)
Operating income
(Million euros)
Number of employees (1)
Provisions and others
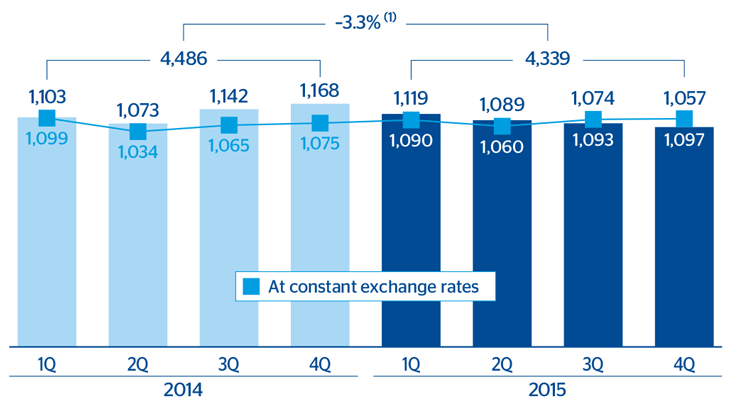
Impairment losses on financial assets continue the downward trend of previous quarters. In 2015, they fell by 3.3% on 2014 (up 1.6% at constant exchange rates). By areas, there was a decline in the Eurozone and a limited increase in the rest of the geographical areas, very much in line with the growth in activity. The above explains why the cumulative cost of risk as of December 2015 (1.06%) is below the figure for the close of the first nine months of the year (1.10%) and for 2014 (1.25%).
Impairment losses on financial assets
(Million euros)
Allocation to provisions, which include the cost of the transformation plans, provisions for contingent liabilities and other commitments, as well as contributions to pension funds, were below the 2014 figure (down 36.6% or 30.9% at constant exchange rates).
Good performance also of the other gains (losses) heading, strongly affected by lower impairment losses on real-estate activity in Spain from provisions on property and foreclosed or acquired assets.
Profit
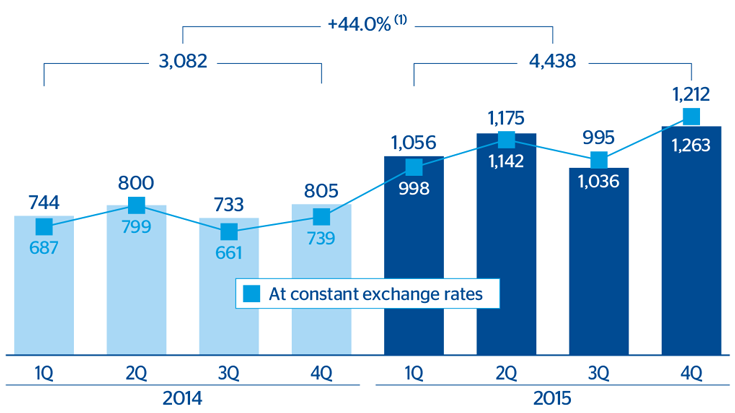
Net income from ongoing operations in 2015 grew year-on-year by 44.0% (up 53.8% excluding the effect of currencies).
The line results from corporate operations heading includes capital gains of €705m net of tax originated by the various sale operations equivalent to 6.34% of BBVA Group’s stake in CNCB; the credit of €26m, also net of tax, for the badwill generated in the CX deal; the effect (practically neutral) of the close of the sale of BBVA’s entire stake in CIFH; and the impact of the valuation at fair value of the 25.01% stake held by BBVA in Garanti at the time when the acquisition of an additional 14.89% was completed (amounting to a negative €1,840m in the third quarter).
Net income from ongoing operations
(Million euros)
Lastly, attributable profit from ongoing operations in 2015, which consists of the Group’s net attributable profit excluding results from corporate operations totaled €3,752m, up 43.3% on 2014. Attributable economic profit from ongoing operations reached €619m.
Net attributable profit
(Million euros)
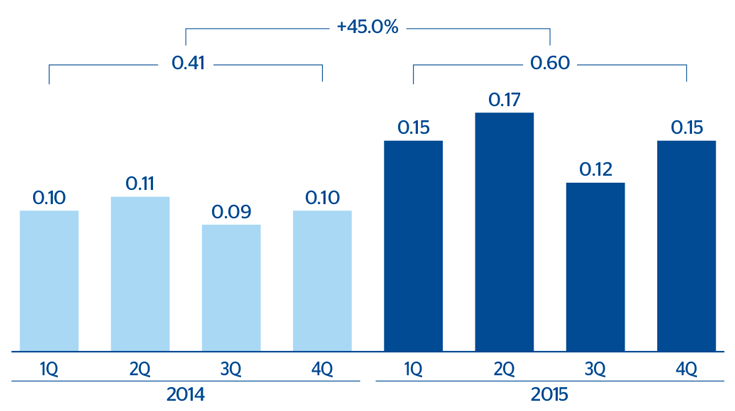
Earnings per share (1)
(From ongoing operations. Euros)
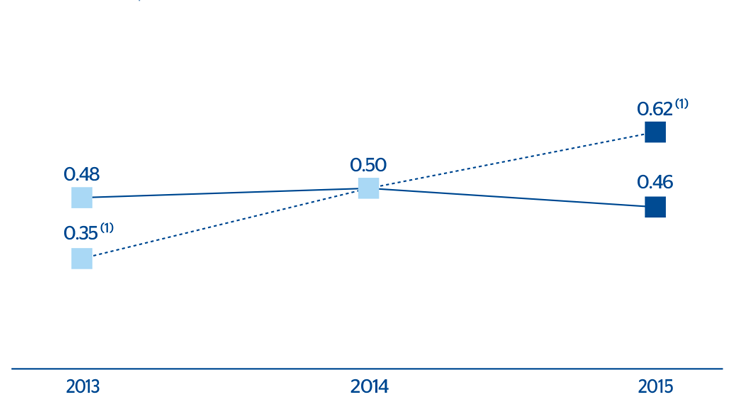
ROA
(Percentage)
ROE and ROTE
(Percentage)
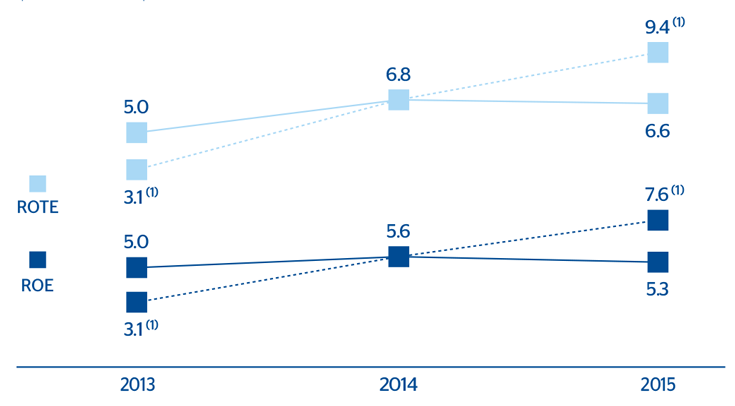
BBVA Group not including Venezuela and with Turkey on an on-going basis
To ensure comparable figures, the Group’s income statement not including Venezuela is shown below (due to the exchange-rate impact), with Turkey presented on an on-going basis (to isolate the effects of the purchase of an additional 14.89% stake in Garanti, as already mentioned).
 Download Excel
|
|
Million euros | |||
|---|---|---|---|---|
| Consolidated income statement of BBVA Group excluding Venezuela and with Turkey presented on a like-for-like comparison | 2015 | Δ% | Δ% at constant exchange rates | 2014 |
| Net interest income | 14,923 | 13.1 | 10.9 | 13,191 |
| Net fees and commissions | 4,398 | 8.3 | 5.0 | 4,062 |
| Net trading income | 2,057 | 1.6 | (0.2) | 2,024 |
| Other income/expenses | 661 | (7.5) | (7.9) | 715 |
| Gross income | 22,039 | 10.2 | 7.9 | 19,992 |
| Operating expenses | (11,545) | 11.9 | 8.7 | (10,318) |
| Operating income | 10,494 | 8.5 | 7.0 | 9,675 |
| Impairment on financial assets (net) | (4,057) | (4.7) | (4.9) | (4,257) |
| Provisions (net) and other gains (losses) | (1,112) | (36.5) | (36.8) | (1,752) |
| Income before tax | 5,325 | 45.2 | 40.8 | 3,666 |
| Income tax | (1,280) | 45.7 | 41.2 | (878) |
| Net income from ongoing operations | 4,045 | 45.1 | 40.6 | 2,788 |
| Results from corporate operations (2) | (1,109) | n.m. | n.m. | - |
| Net income | 2,936 | 5.3 | 2.1 | 2,788 |
| Non-controlling interests | (370) | 11.4 | 5.9 | (332) |
| Net attributable profit | 2,566 | 4.5 | 1.5 | 2,456 |
| Net attributable profit from ongoing operations (3) | 3,675 | 49.7 | 45.4 | 2,456 |

